Data Mesh vs Data Fabric
Data Mesh vs Data Fabric: Differences, Costs & Uses Reviewed and updated: July 2026 Most organizations don’t struggle to store data anymore. They struggle…
Read article
Data Mesh vs Data Fabric: Differences, Costs & Uses Reviewed and updated: July 2026 Most organizations don’t struggle to store data anymore. They struggle…
Read article
Your sales dashboard reports $1.2 million in revenue, the accounting system reports $1.1 million, and the CRM shows a different customer total altogether. The…
Read article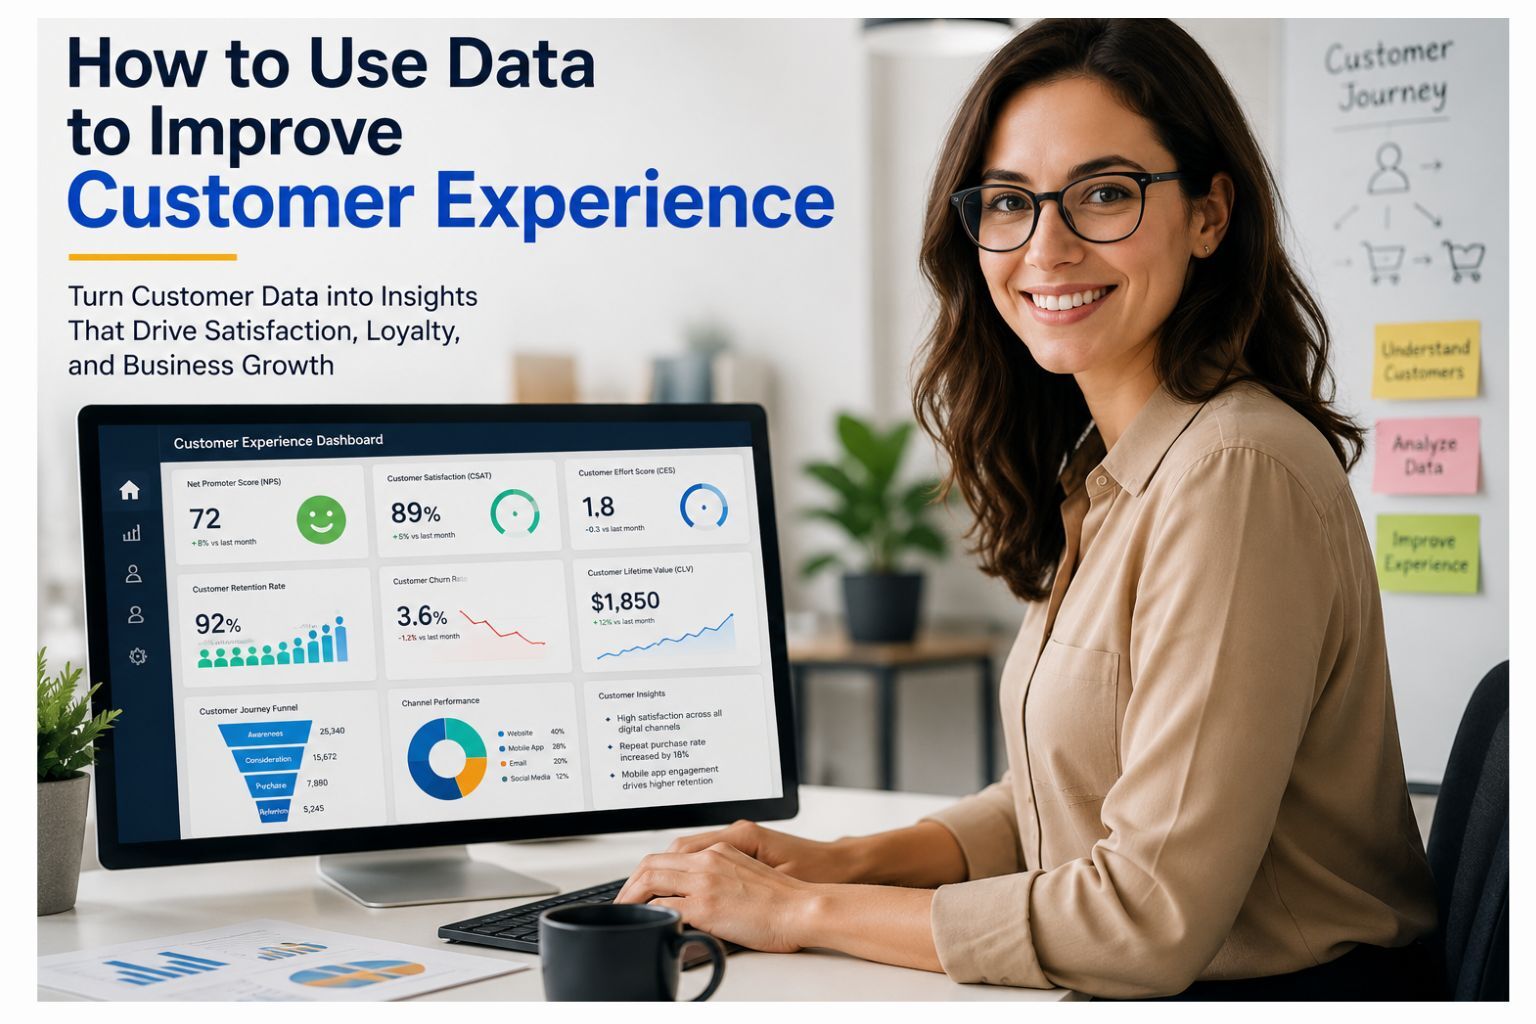
Customer expectations have changed dramatically over the past decade. Today’s customers expect businesses to recognize their preferences, understand their needs, and deliver personalized experiences…
Read article
Why Quantitative Data Analysis Matters Understanding the types of data analysis in quantitative research is important because every research project depends on choosing the…
Read article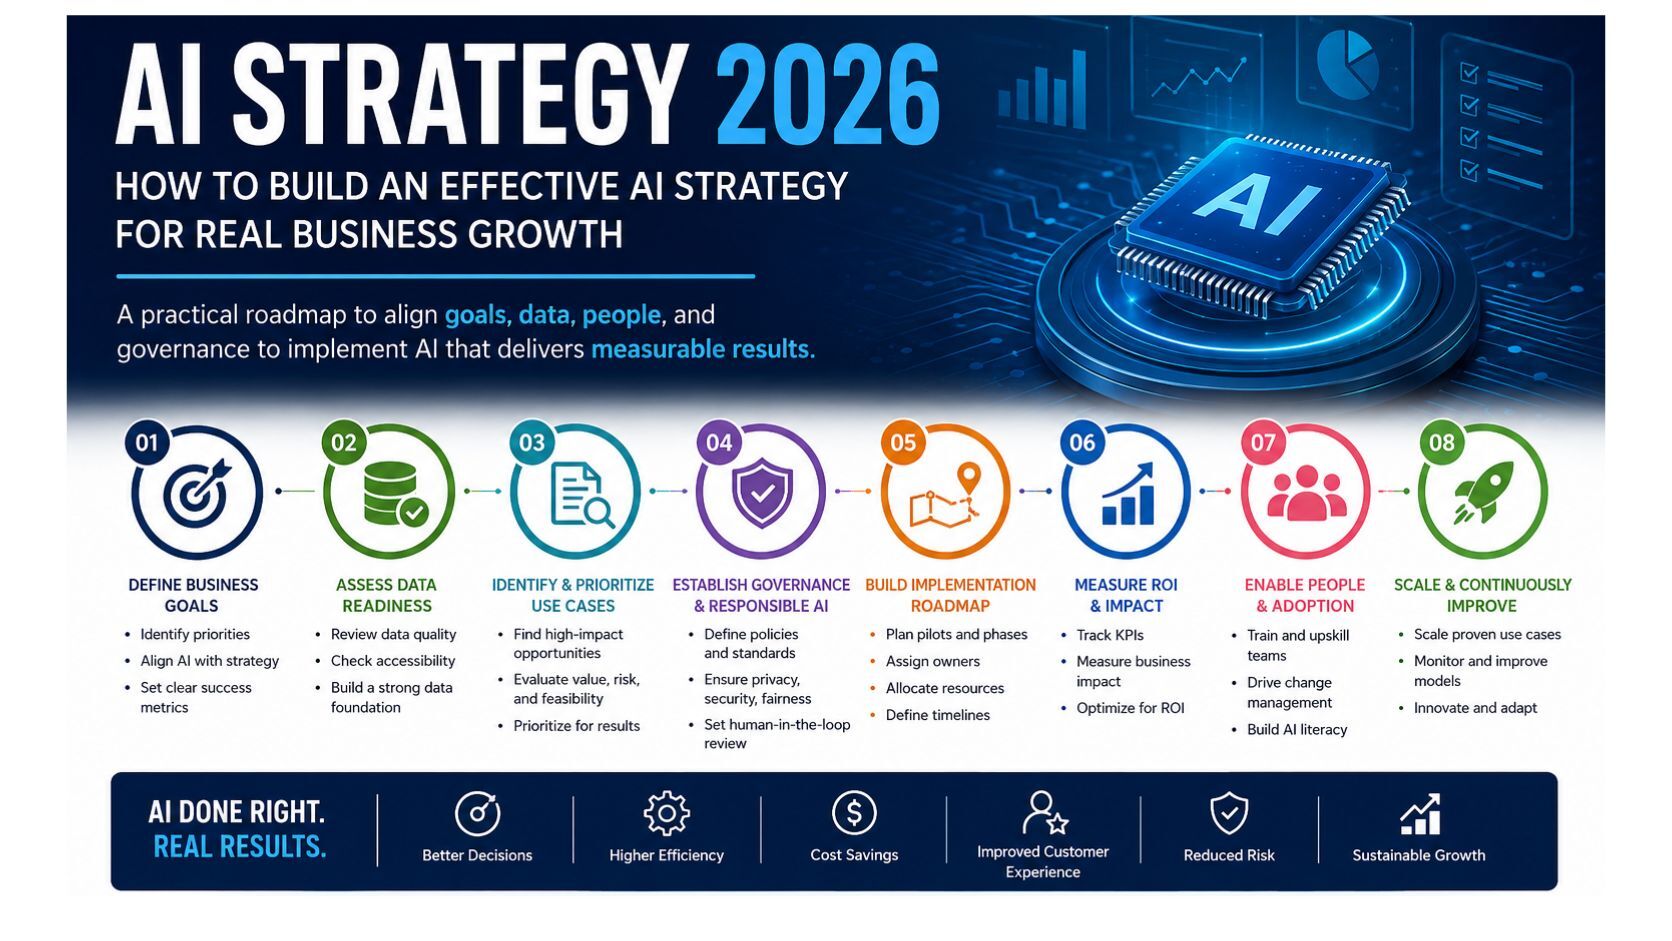
An AI strategy 2026 plan helps businesses move from scattered AI experiments to clear, measurable, and responsible implementation. Many organizations are no longer asking…
Read article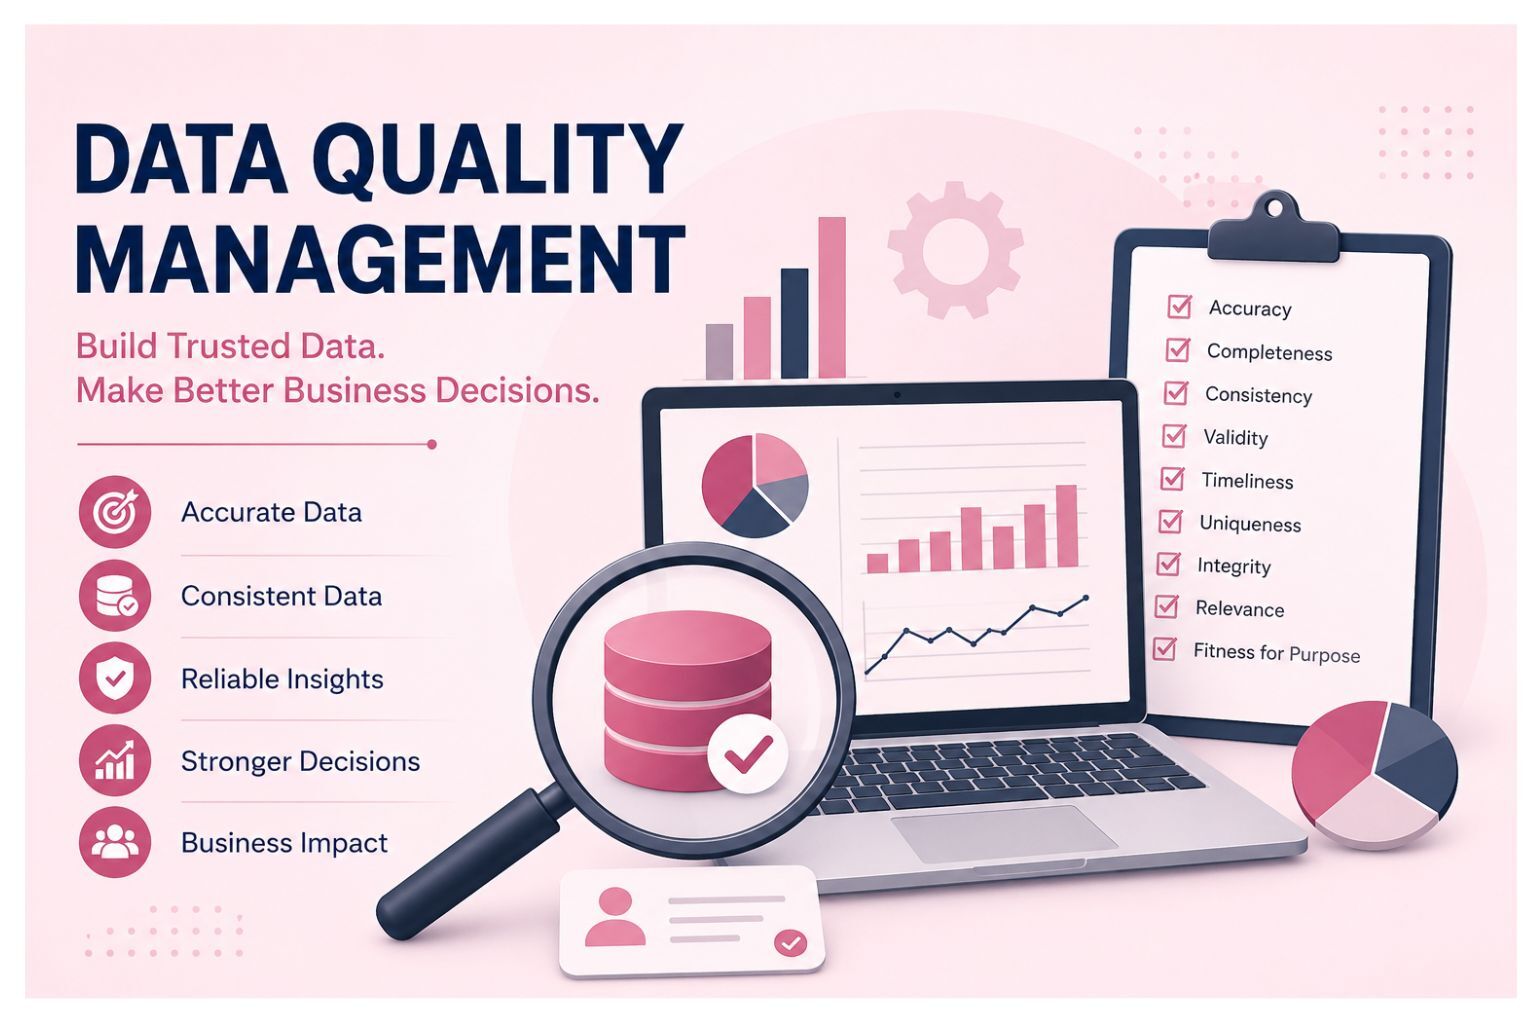
How to Build Reliable Data for Better Business Decisions Most companies are not short of data. They collect information from CRM systems, ERP platforms,…
Read article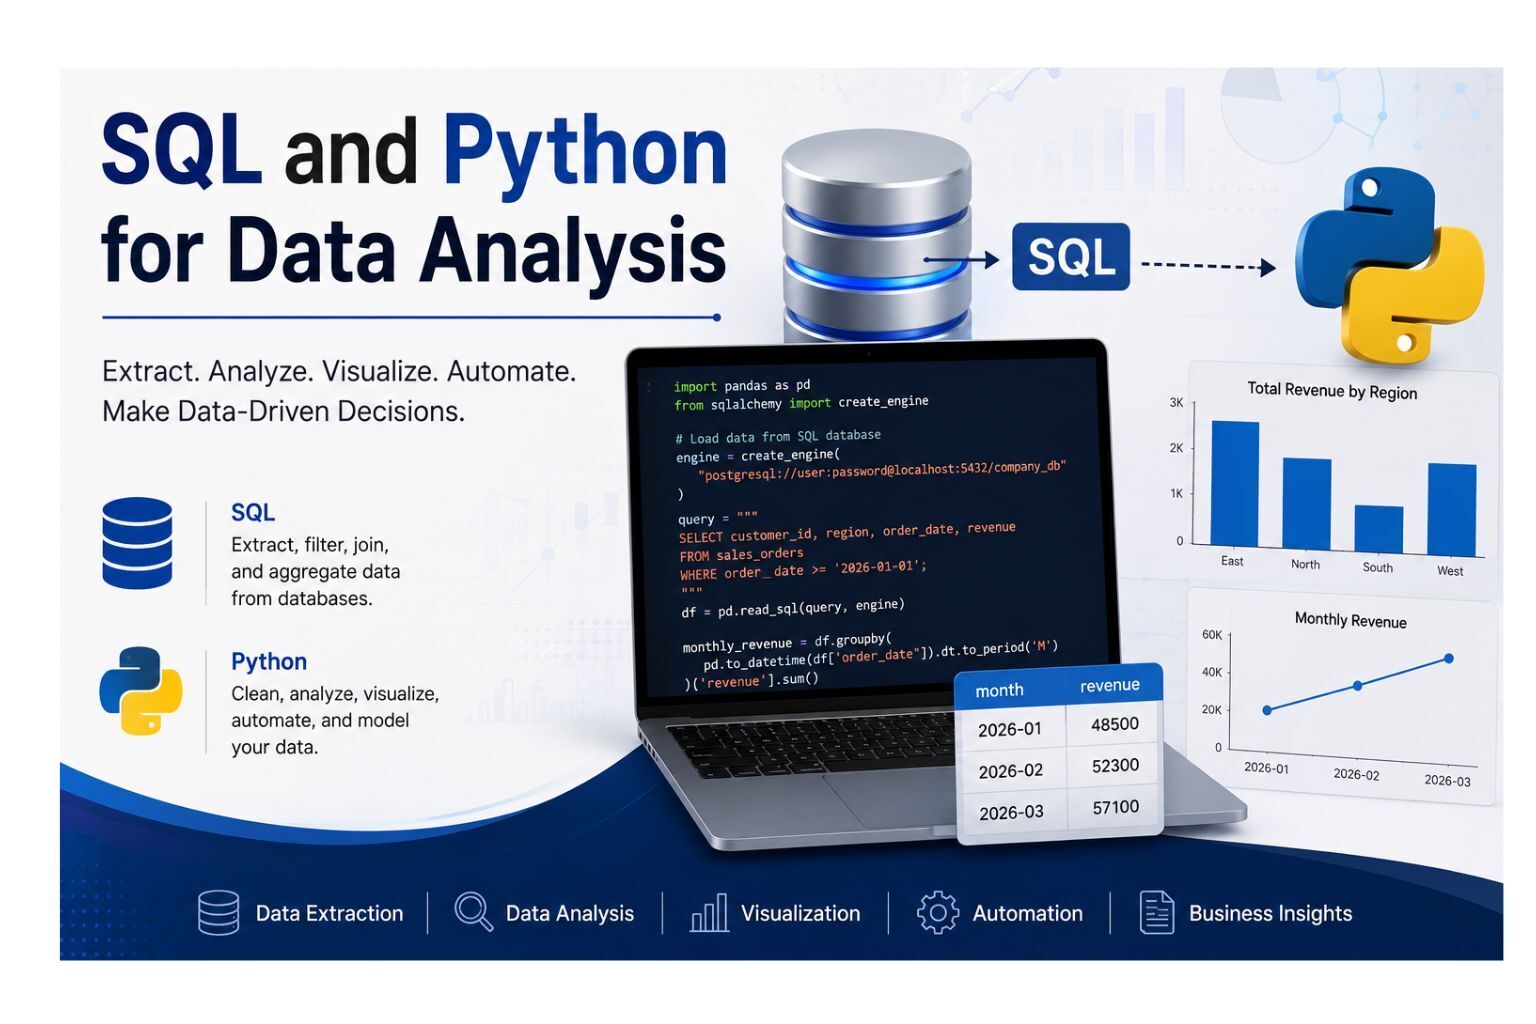
Learn the Tools, See Examples, and Turn Data Into Business Insights Python for Data Analysis is one of the most practical ways to turn…
Read article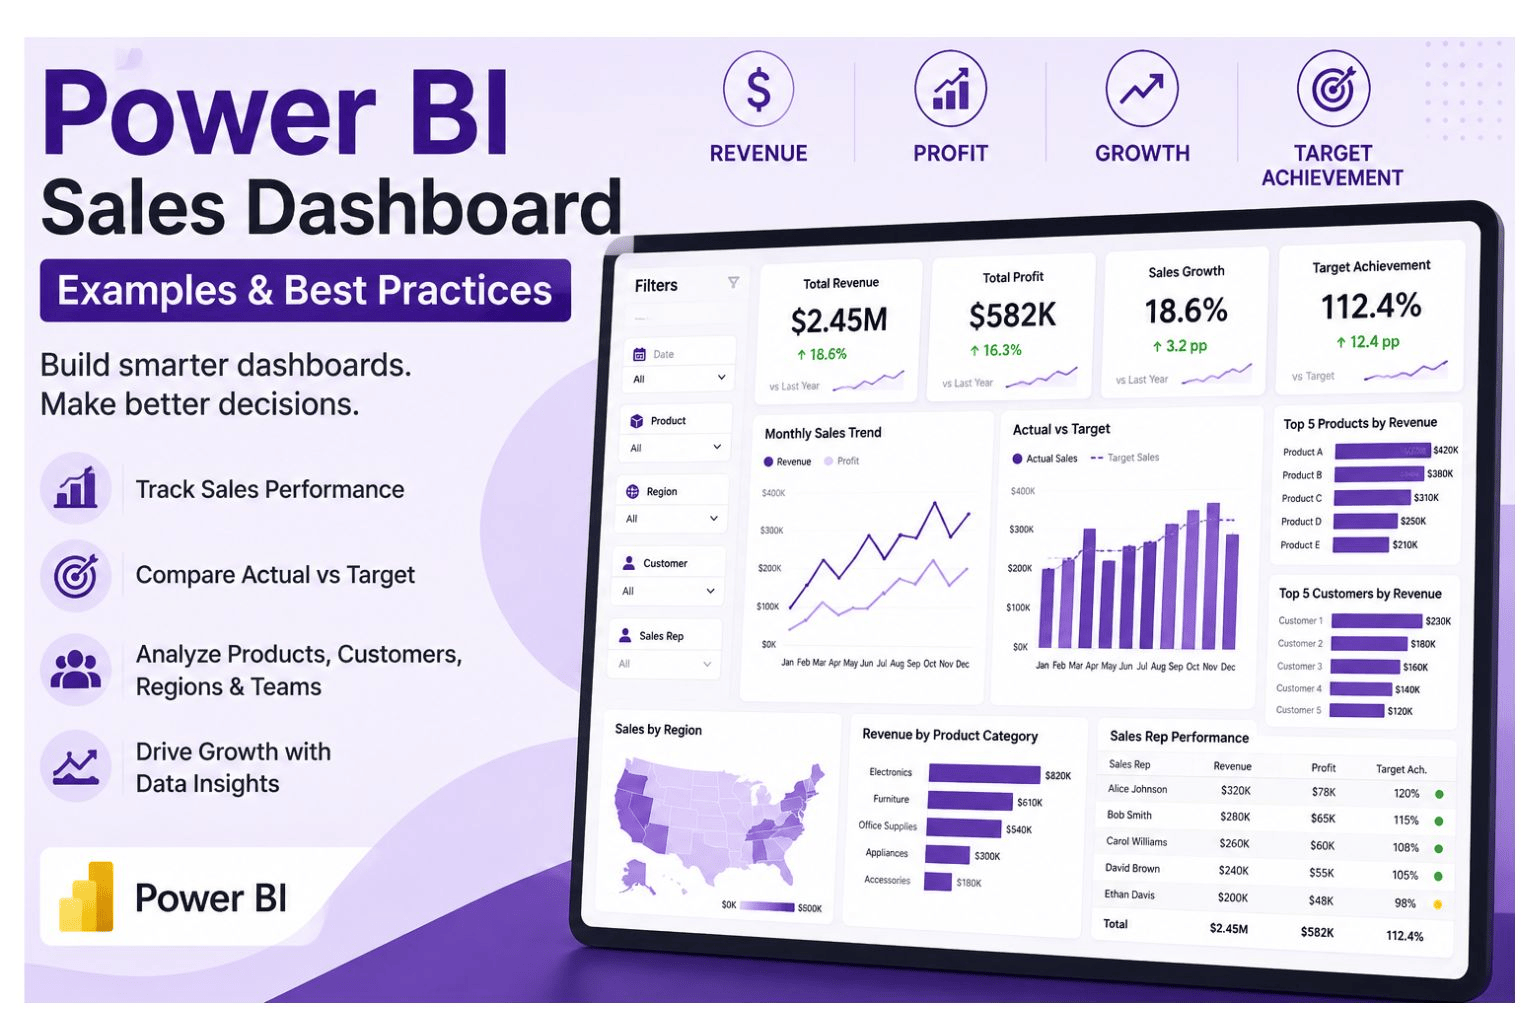
Many businesses collect sales data every day, but they still struggle to see what is really happening in sales performance. Revenue may be stored…
Read article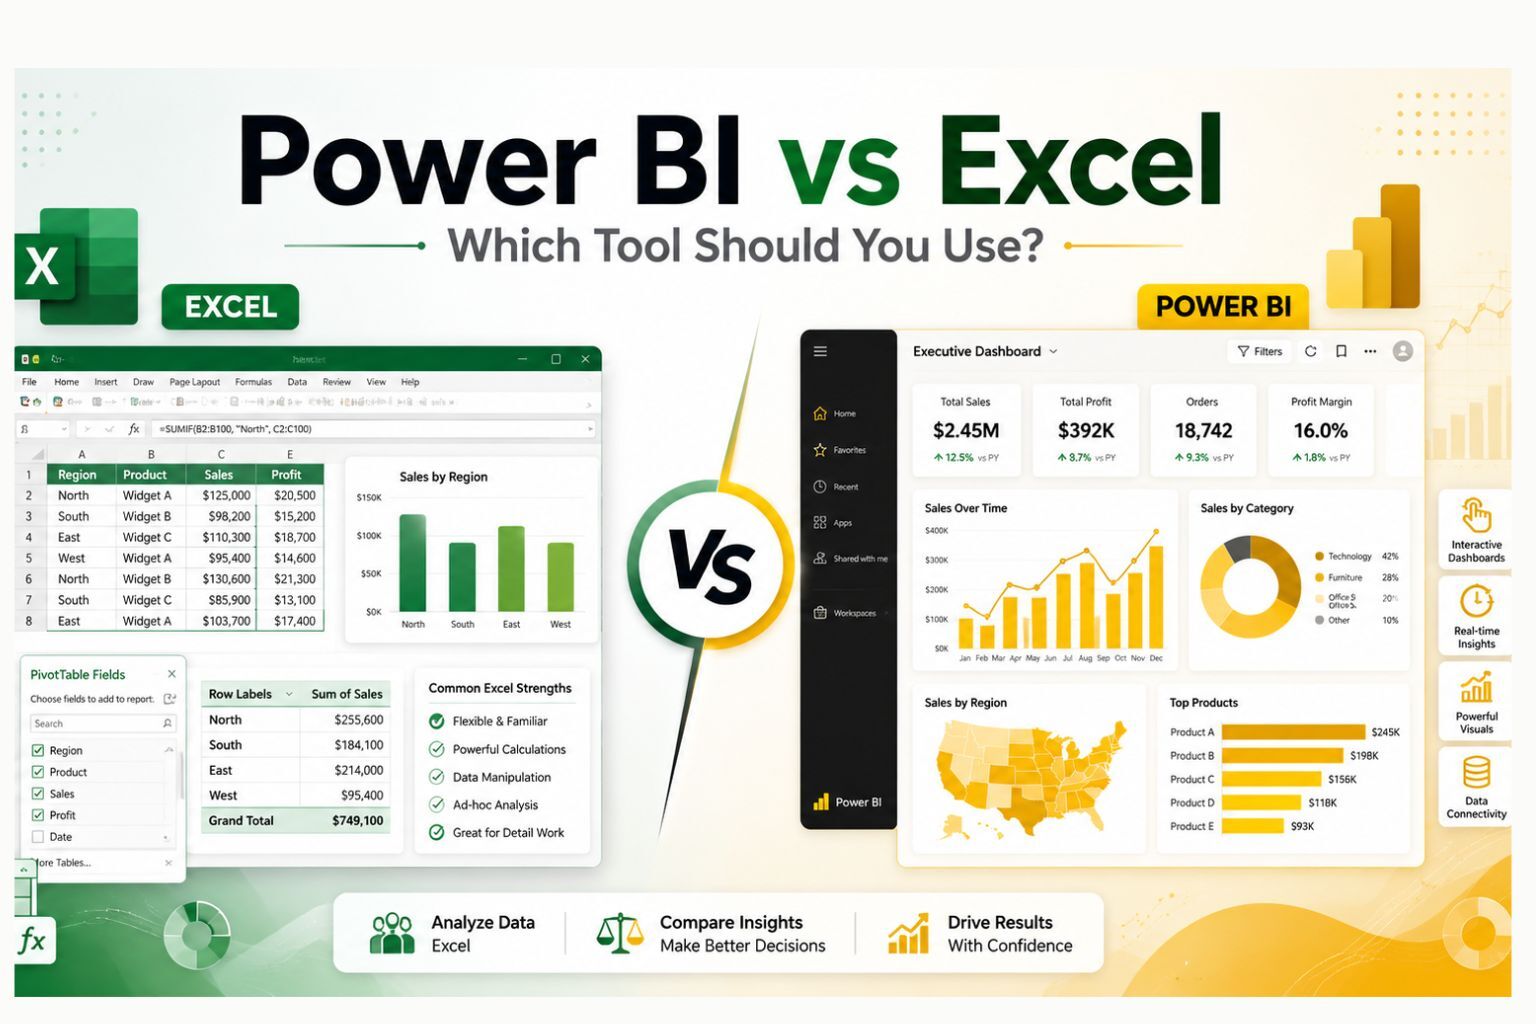
Power BI vs Excel: Which Tool Should You Use? Power BI vs Excel is one of the most important decisions for businesses that are…
Read article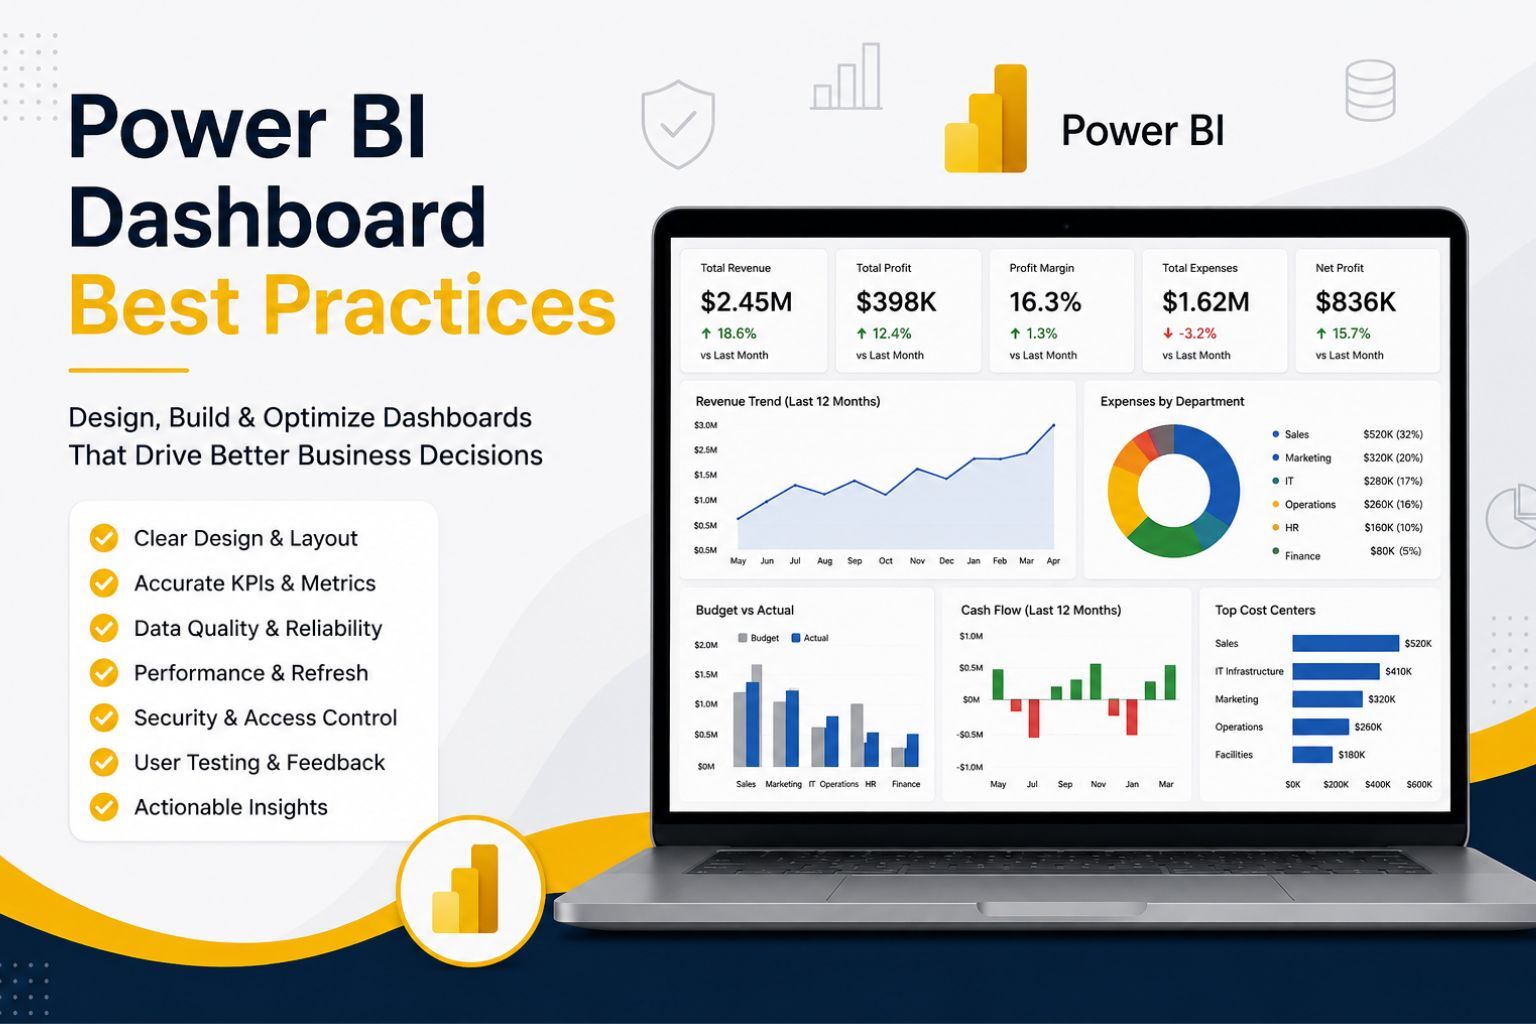
How to Create a Dashboard in Power BI: Complete Step-by-Step Guide A Power BI dashboard helps businesses turn raw data into clear, visual insights…
Read article