
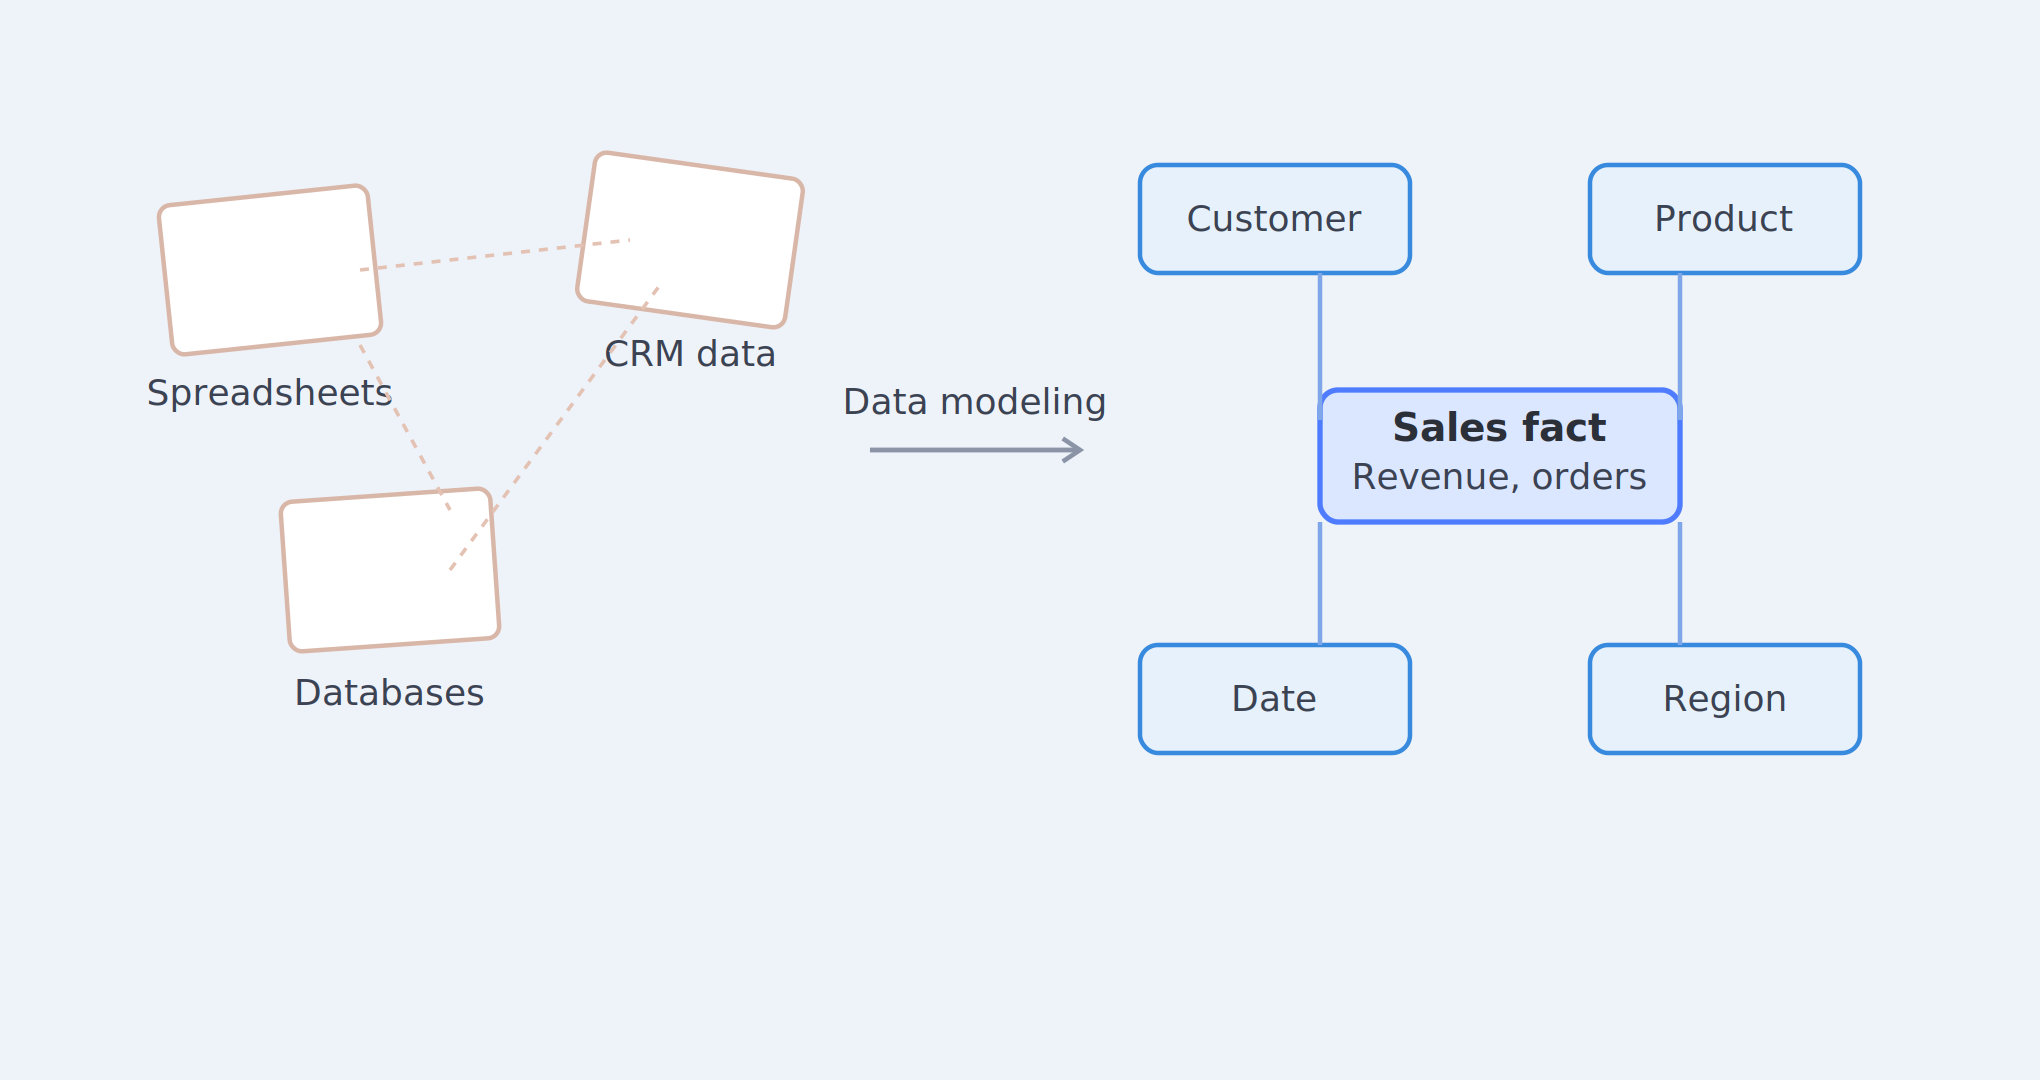
Clean, structure, and connect your data for better business decisions
Most businesses already have data. Few have a structure that makes it trustworthy. Sales reports one revenue number, finance reports another, and marketing tracks leads in a way that doesn’t connect to closed deals. None of that is a dashboard problem. It’s a data model problem: the tables, relationships, and definitions behind the dashboard were never built to agree with each other.
At Data Science Consulting Pro, we design data models that connect your customers, orders, products, invoices, subscriptions, and revenue into one structure your whole team can trust, whether that structure feeds Power BI, dbt, a cloud warehouse, or an executive scorecard.
Problems our data modeling services solve
| Data problem | What it causes | How modeling helps |
|---|---|---|
| Messy spreadsheets | Manual errors, duplicated work | Structured, repeatable reporting logic |
| Duplicate customer records | Wrong counts, poor segmentation | Cleaner IDs and matching rules |
| Slow dashboards | Long refresh times | Better relationships and schema design |
| Disconnected systems | Incomplete or missing insights | One structure connecting all sources |
| Inconsistent KPIs | Departments report different numbers | Standardized definitions and business rules |
| Weak warehouse structure | Slow queries, hard maintenance | Scalable, reporting-ready model |
| Poor documentation | Nobody understands the fields or logic | Data dictionaries and KPI definitions |
Data modeling services we provide
Conceptual and logical data modeling
Conceptual modeling maps the main business areas that matter (customers, orders, products, campaigns) before any technical work starts, so stakeholders agree on the picture early. Logical modeling adds the next layer of detail: entities, fields, keys, and the rules connecting them, such as whether one customer can have many orders.
Physical database modeling
Physical modeling turns that design into an actual database structure: table names, column types, primary and foreign keys, indexes, and partitioning. This is where poor decisions become slow queries and broken joins, so it’s built with your reporting workload in mind, not just as a storage exercise.
Dimensional and star schema modeling
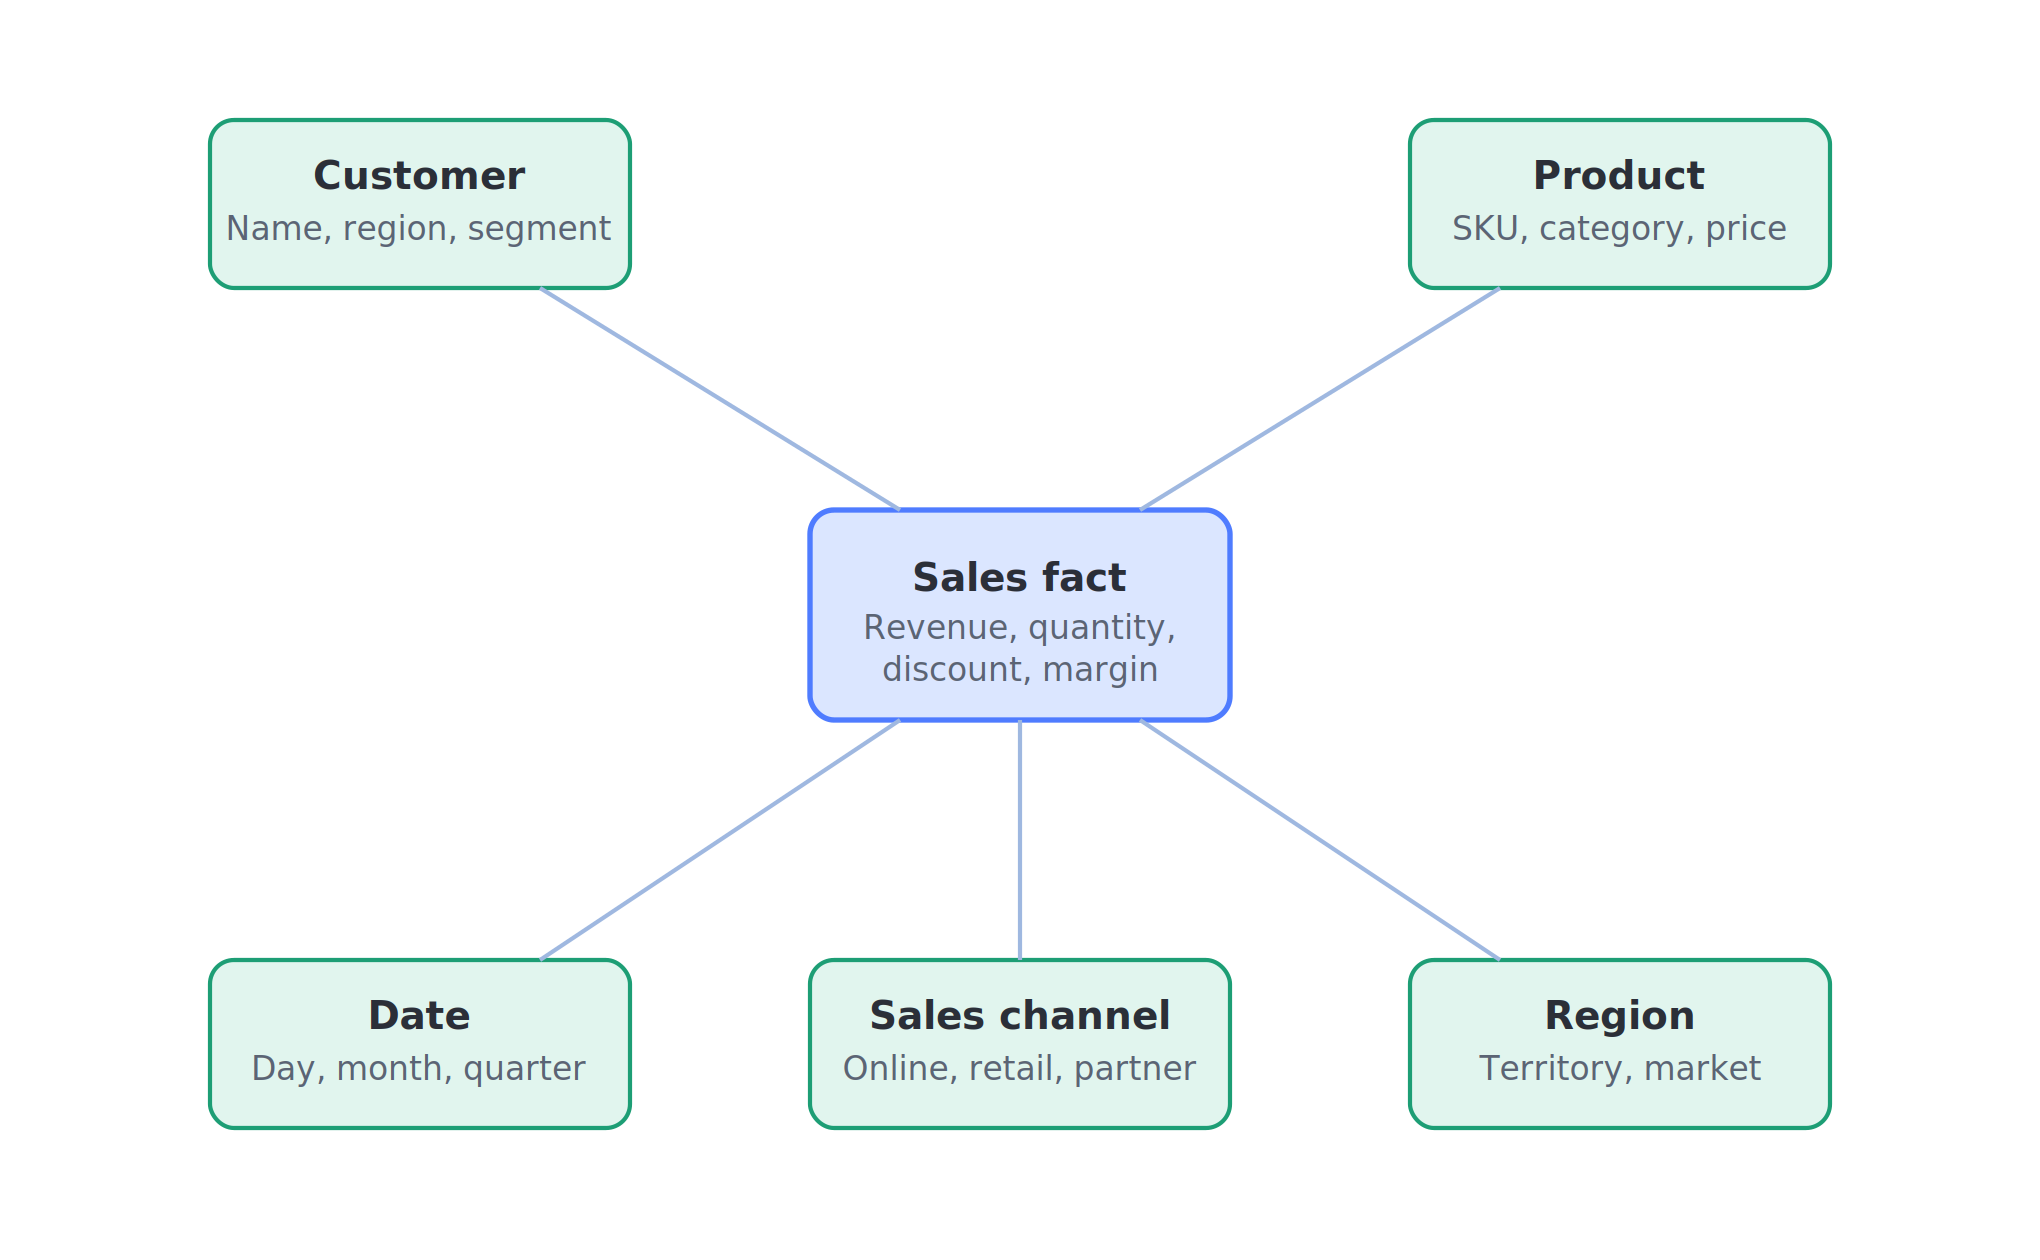
Dimensional models organize data into fact tables (measurable activity like revenue or orders) and dimension tables (context like customer, product, or date). This is the structure that makes Power BI, Tableau, and Looker dashboards fast and filterable, and it’s the approach we default to for analytics-focused projects.
Power BI data modeling
Most Power BI problems (wrong totals, broken filters, slow refreshes) trace back to the model, not the visuals: missing date tables, weak DAX measures, or poorly related tables. We clean up relationships, rebuild DAX logic, and restructure the model so the dashboard on top of it is fast and correct.
Data warehouse and dbt modeling
For teams centralizing data from a CRM, ERP, payment platform, and marketing tools into one warehouse, we design the staging, intermediate, and mart layers in dbt (or an equivalent framework) so the path from raw source data to a trusted reporting table is documented and testable, not a pile of one-off SQL scripts.
Data modeling deliverables
| Deliverable | Description |
|---|---|
| Conceptual data model | High-level map of key business entities and relationships |
| Logical data model | Detailed structure of fields, keys, rules, and relationships |
| Physical data model | Database-ready design with tables, columns, and technical rules |
| Entity relationship diagram | Visual diagram of how entities connect |
| Star or snowflake schema | Fact and dimension structure for analytics |
| Power BI model cleanup | Improved relationships, DAX, date tables, performance |
| dbt model structure | Staging, intermediate, and mart layers |
| Data dictionary and KPI definitions | Documentation your team can maintain after we leave |
| Source-to-target mapping | How data moves from each source into the final model |
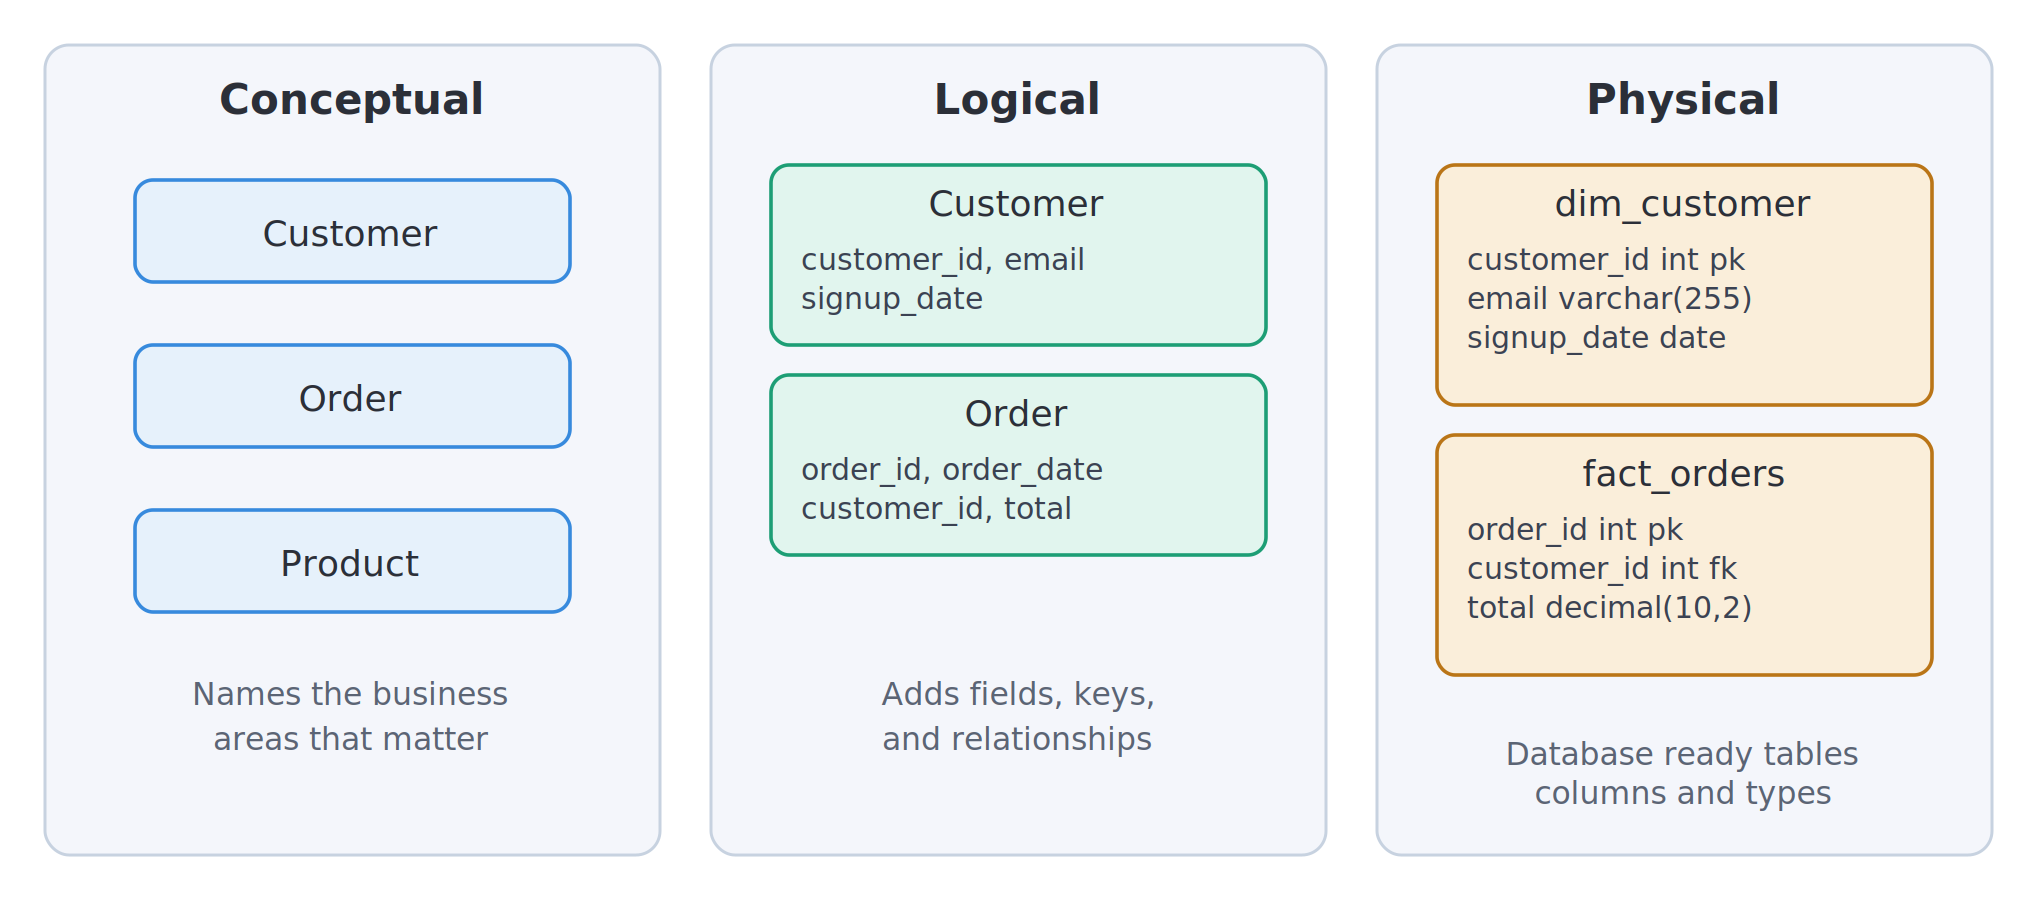
Example data modeling project
Client problem: An online retailer stored customer, order, product, and marketing campaign data in five separate systems. Finance, marketing, and the leadership dashboard each reported a different monthly revenue figure, and nobody could say with confidence which one was right.
Our work: We mapped customer, order, product, campaign, and date dimensions around a central sales fact table, defined a single revenue calculation used across every report, and documented the logic so the client’s analyst could maintain it without us.
Deliverables: entity relationship diagram, star schema, KPI definition document, source-to-target mapping, and Power BI-ready reporting tables.
Outcome: Finance, marketing, and the executive dashboard now pull from the same structure and the same revenue definition, and the monthly reconciliation meeting that used to compare three conflicting numbers no longer happens.
Our data modeling process
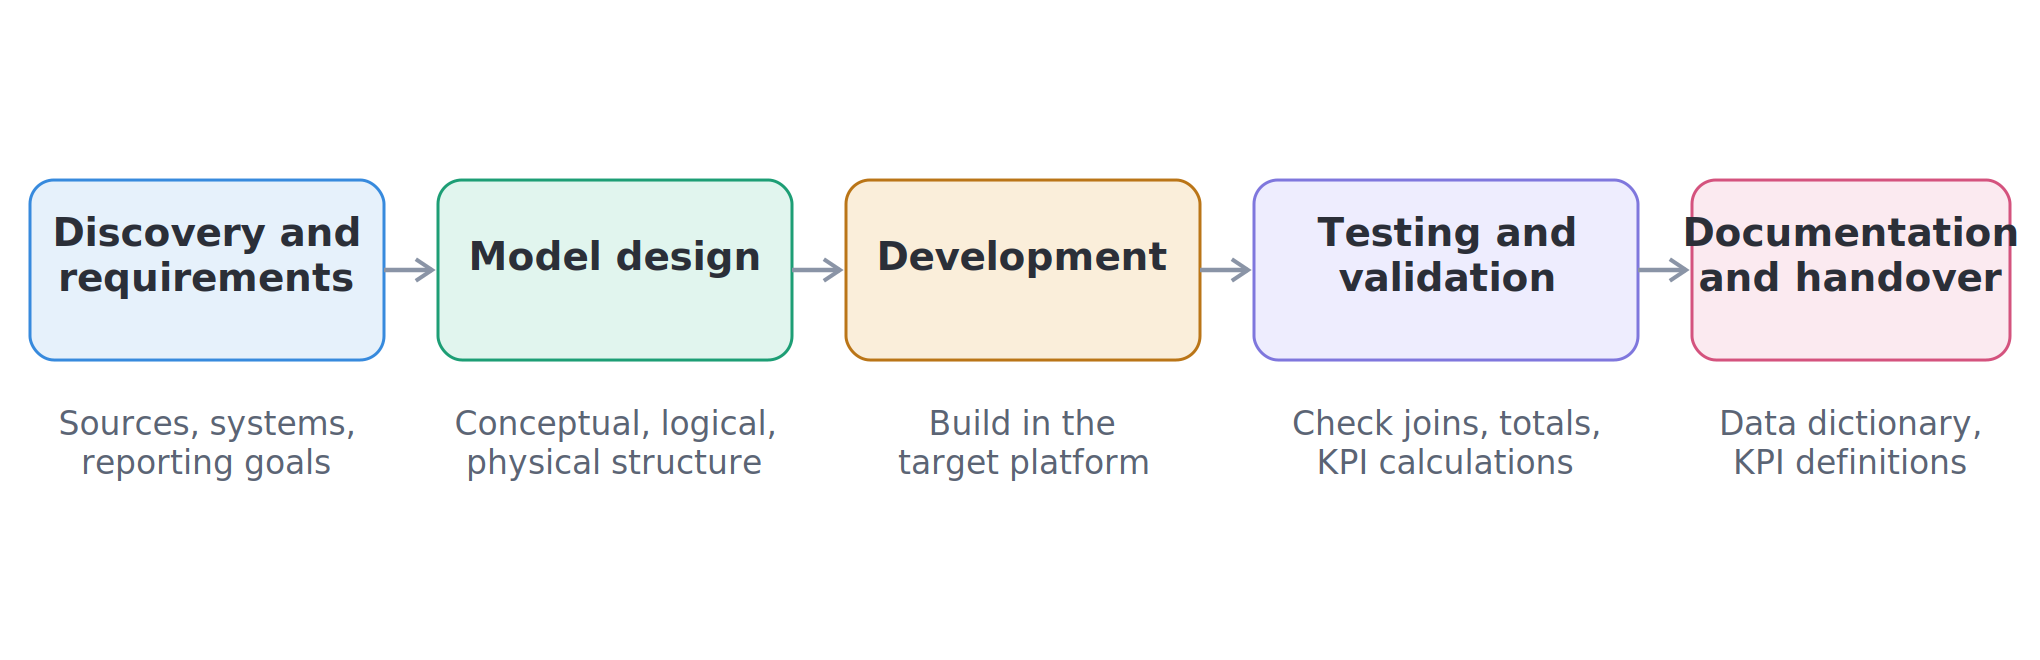
- Discovery and requirements. We review your current sources, systems, and the reports that are causing problems, and confirm what the business actually needs to measure.
- Model design and review. We build the conceptual, logical, physical, or dimensional model appropriate to the project, sized to support future data sources, and review it with you before development starts so structure and KPI logic are confirmed early.
- Development. We build the model in your target platform: a SQL database, cloud warehouse, Power BI, or dbt.
- Testing and validation. We check relationships, joins, totals, and KPI calculations against numbers your team already trusts, such as an approved finance revenue figure.
- Documentation and handover. You receive a data dictionary, KPI definitions, and relationship notes so your team can maintain the model without depending on us.
Tools and platforms we support
| Category | Tools and platforms |
|---|---|
| BI and reporting | Power BI, Tableau, Looker Studio, Excel |
| Data transformation | SQL, Python, dbt, Power Query |
| Cloud warehouses | Snowflake, BigQuery, Redshift, Azure Synapse, Microsoft Fabric |
| Databases | SQL Server, PostgreSQL, MySQL |
| Data sources | APIs, CRM systems, ERP systems, marketing platforms |
Industries we support
| Industry | Typical modeling need | Possible deliverable |
|---|---|---|
| SaaS | Subscriptions, users, churn, revenue | SaaS metrics model |
| Ecommerce | Customers, orders, products, inventory | Star schema |
| Finance | Transactions, budgets, profitability | Finance reporting model |
| Professional services | Projects, clients, billing, utilization | Profitability model |
| Research and nonprofits | Participants, responses, outcomes | Analysis-ready relational model |
If your industry isn’t listed, tell us your reporting goals and current systems when requesting a quote. Most modeling problems (disconnected sources, unclear KPIs, slow dashboards) look similar across industries even when the underlying data doesn’t.
Remote data modeling services across the United States
Data Science Consulting Pro provides remote data modeling support to businesses across the United States. We work with organizations that need stronger data structures for Power BI, business intelligence, cloud data warehouses, dbt workflows, and reporting, regardless of city or time zone.
Why choose Data Science Consulting Pro?
A weak data model creates reporting problems that outlast any one dashboard. We focus on models that are practical and documented well enough that your team can maintain them without us, not proprietary structures only we understand.
Every engagement has a single lead consultant who scopes the project, reviews the design with you before development starts, and signs off on the final delivery, so questions about a modeling decision don’t get lost between people.
| Reason | What it means for you |
|---|---|
| Business-first approach | We design around the decisions and KPIs your team actually needs |
| Power BI and dbt experience | We can fix an existing model, not just build a new one |
| Clear documentation | Data dictionaries and KPI definitions ship with every project |
| Validated against your numbers | We test the model against figures your team already trusts, not just against itself |
Pricing and project scope
Every project is scoped after we review your current systems and data, but here’s a realistic sense of range:
| Project type | Typical starting range | What drives the final price |
|---|---|---|
| Power BI model cleanup (existing model) | $800 to $2,500 | Number of tables, DAX complexity, current issues |
| New dimensional or star schema model | $2,500 to $8,000 | Number of fact and dimension tables, source count |
| Data warehouse or dbt modeling project | $5,000 to $20,000+ | Source systems, transformation complexity, layers needed |
| Documentation only (data dictionary, KPI definitions) | $500 to $1,500 | Number of fields and metrics to document |
These are starting ranges based on typical projects, not fixed quotes. Minimum project scope is a single Power BI model review or documentation package; minimum project fee is $500.
What we need from you: access to (or exports from) your current data sources, a list of the reports or KPIs causing problems, and any existing documentation, even if it’s outdated.
Data security: we request the minimum access needed for the project, for example a read-only warehouse role or a limited Power BI service account, rather than full admin credentials. Credentials and exported data are stored only for the duration of the engagement and removed within 30 days of final delivery. Client data is never used outside the scoped project, and an NDA is available on request before any files or access are shared.
Documentation and handover: every project includes a data dictionary and KPI definitions, so the model doesn’t become unmaintainable the day our engagement ends.
Revision policy: the pilot design review (step 2 of our process) is where model structure and KPI logic get confirmed before we build, so revisions at that stage are expected and included. After final delivery, minor corrections, such as a missed field or a naming fix, are covered for 14 days at no charge. Requests that change scope, such as adding a new data source or a new fact table, are quoted separately.
Frequently asked questions
Data modeling builds the structure; data analysis uses that structure to answer questions. Analysis becomes harder and slower when the underlying model is weak, since analysts end up cleaning and joining data instead of studying it.
Yes. Most of our Power BI and dbt work is optimization: cleaning relationships, fixing DAX measures, and simplifying an existing model rather than starting over.
Yes. Broken relationships, missing date tables, and weak DAX measures are the most common causes of slow or inaccurate Power BI dashboards, and that’s usually where we start.
A Power BI model cleanup can take 1 to 2 weeks. A full data warehouse or dbt project with multiple source systems typically takes 4 to 8 weeks. We confirm a specific timeline after reviewing your current environment.
Yes. Share your current systems and reporting goals when requesting a quote and we’ll confirm fit before scoping.
Yes. Clean, consistent, well-documented data is a prerequisite for reliable machine learning results. If your data structure is inconsistent, that inconsistency carries into the model.
We request the minimum access level a project needs, such as read-only warehouse credentials, rather than full admin rights, and remove stored credentials and exported data within 30 days of delivery. An NDA is available on request.
Minor corrections are covered free for 14 days after delivery. Requests that add scope, like a new data source or fact table, are quoted as a separate small project.
Request a data modeling services quote
If your reports don’t match, your dashboards are slow, or your data is scattered across five different systems, we can help you build a structure your team can actually trust.