
Why Quantitative Data Analysis Matters
Understanding the types of data analysis in quantitative research is important because every research project depends on choosing the right method for the right question. Quantitative research uses numerical data to describe patterns, compare groups, test hypotheses, measure relationships, predict outcomes, and support evidence-based decisions.
However, many research and business projects become weak at the analysis stage. The problem is usually not the software. The problem is often poor data cleaning, unclear research questions, wrong statistical tests, ignored assumptions, weak interpretation, or results copied directly from SPSS, R, Python, Excel, or Power BI without explaining what they mean.
For example, a researcher may use correlation when the real question requires regression. A business analyst may build a dashboard before checking whether the data is accurate. A student may report only p-values without explaining effect size, direction, or practical meaning. A company may make decisions from incomplete survey data without checking missing values, outliers, or response bias.
The right analysis method depends on the research question, variable type, sample size, study design, assumptions, and reporting goal. A customer satisfaction project may require descriptive statistics, reliability analysis, correlation, regression, and visualization. A clinical or business experiment may require pre-test and post-test comparison. A forecasting project may require time series analysis, regression, or predictive analytics.
At DataScienceConsultingPro.com, our Data Analysis Services help researchers, businesses, and organizations clean datasets, choose suitable methods, run statistical tests, interpret results, and prepare clear reports, dashboards, and decision-ready insights.
This guide explains the main types of quantitative data analysis, when to use each method, practical examples, key assumptions, common mistakes, pricing factors, and when to hire a quantitative data analysis consultant.
What Is Quantitative Data Analysis?
Quantitative data analysis is the process of cleaning, organizing, summarizing, testing, modeling, and interpreting numerical data. It turns raw numbers into meaningful evidence that can answer research questions, validate hypotheses, measure performance, explain relationships, or support business decisions.
Quantitative data analysis is used in academic research, healthcare research, business research, survey research, customer analytics, finance, operations, experiments, market research, and performance tracking. It can be simple, such as calculating averages and percentages, or advanced, such as building predictive models, running regression, or analyzing multiple variables at the same time.
For example, a business may use quantitative analysis to measure whether customer satisfaction predicts repeat purchases. A healthcare researcher may compare patient outcomes before and after an intervention. A marketing team may test whether campaign spending is associated with lead conversion. A university researcher may analyze survey responses to test whether attitudes differ across demographic groups.
Quick answer: Quantitative data analysis uses numerical data and statistical methods to describe patterns, test hypotheses, compare groups, examine relationships, predict outcomes, and support evidence-based decisions.
Why Choosing the Right Type of Data Analysis Matters
Choosing the correct type of data analysis matters because each method answers a different question. A t-test, ANOVA, chi-square test, correlation, regression, time series model, or dashboard analysis cannot be used interchangeably.
The correct method depends on the research question, hypothesis, variable type, sample size, study design, number of groups, measurement level, distribution, independence of observations, assumptions, and reporting goal.
| Research Goal | Best Analysis Direction |
|---|---|
| Summarize a dataset | Descriptive analysis |
| Explore patterns and data quality | Exploratory analysis |
| Compare two groups | t-test or nonparametric equivalent |
| Compare three or more groups | ANOVA or nonparametric equivalent |
| Test association between categories | Chi-square test |
| Measure relationship between numerical variables | Correlation analysis |
| Predict an outcome | Regression or predictive analytics |
| Identify hidden dimensions | Factor analysis or principal component analysis |
| Estimate cause-and-effect | Experimental or causal analysis |
| Monitor business performance | Dashboard and business intelligence analysis |
The strongest quantitative analysis starts before software is opened. The analyst should first define the research question, identify the outcome variable, check the dataset, review variable types, inspect assumptions, and decide what type of evidence is needed.
Main Types of Data Analysis in Quantitative Research
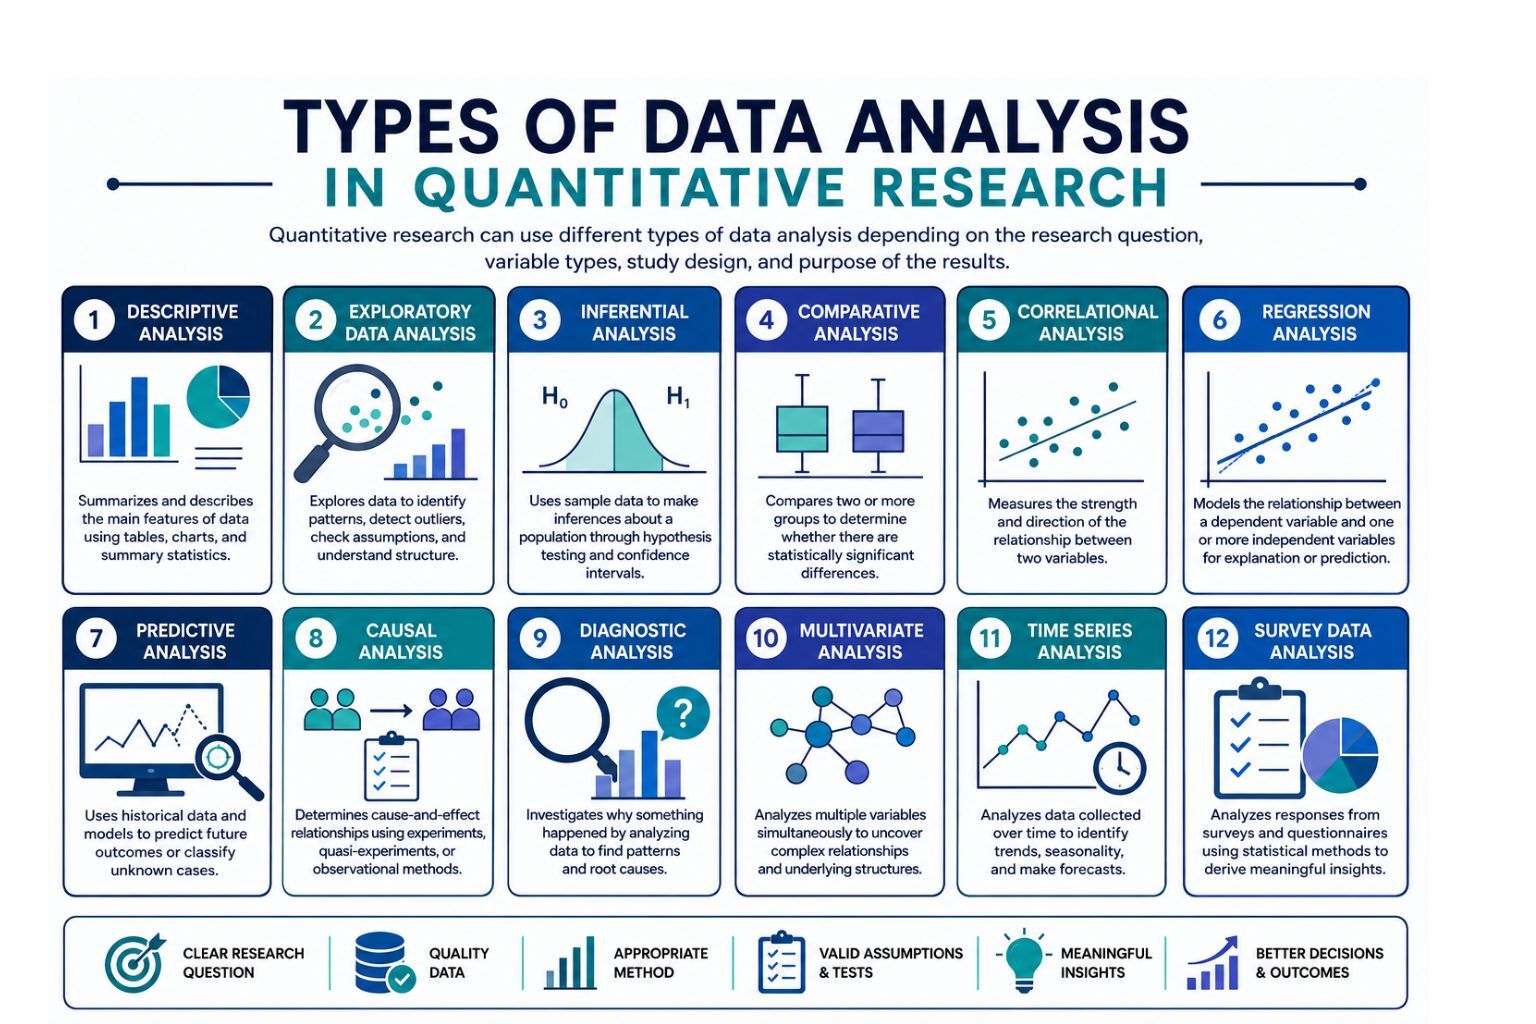
The main types of data analysis in quantitative research include descriptive, exploratory, inferential, comparative, correlational, regression, predictive, causal, diagnostic, multivariate, time series, and survey data analysis. These methods often overlap in real projects.
For example, a survey project may begin with descriptive statistics, then use reliability analysis, correlation, regression, group comparisons, and charts. A business forecasting project may combine exploratory analysis, time series analysis, regression, and predictive modeling. A healthcare study may use descriptive statistics, pre-post comparison, regression, and subgroup analysis.
1. Descriptive Data Analysis
Descriptive data analysis summarizes what is already present in the dataset. It does not test hypotheses or prove relationships. Instead, it helps researchers and decision-makers understand the basic structure, patterns, and characteristics of the data.
Common descriptive statistics include frequencies, percentages, mean, median, mode, range, minimum, maximum, variance, standard deviation, cross-tabulations, charts, and graphs.
Descriptive data analysis is useful for demographic summaries, survey responses, baseline characteristics, business performance summaries, customer profile summaries, healthcare patient characteristics, and financial summaries.
For example, a customer satisfaction survey may use frequencies to show how many customers selected each response category. It may use means to summarize satisfaction scores and bar charts to compare departments or customer groups. A healthcare dataset may use descriptive statistics to summarize patient age, gender, diagnosis category, treatment type, and baseline scores.
Descriptive analysis is also important before advanced analysis. It helps reveal missing values, unusual values, uneven groups, and unexpected patterns. In business reporting, descriptive analysis often becomes the foundation for Dashboard Development Services because dashboards depend on clear metrics, charts, and summaries.
2. Exploratory Data Analysis
Exploratory data analysis, often called EDA, is used to inspect and understand data before formal testing or modeling. It helps analysts identify missing values, outliers, distribution shapes, unusual patterns, coding errors, and possible relationships between variables.
Exploratory analysis may include missing value checks, outlier detection, histograms, boxplots, scatterplots, cross-tabulations, summary tables, and early assumption testing.
EDA matters because it protects the project from hidden data problems. For example, a researcher may discover that one survey item has many missing values, one group has too few participants, or one numerical variable is strongly skewed. A business analyst may discover duplicate customer records, incorrect transaction dates, or unusually high sales values that need investigation.
This stage often connects with Data Cleaning Services because exploratory analysis frequently reveals data problems that must be fixed before final testing.
Skipping EDA can lead to poor statistical choices. For example, if a variable is not normally distributed, a nonparametric test may be more suitable than a standard parametric test. If outliers are present, the analyst must decide whether they are valid extreme values or data entry errors.
3. Inferential Data Analysis
Inferential data analysis uses sample data to make conclusions about a wider population. It helps researchers test hypotheses, estimate uncertainty, and determine whether observed results are likely to reflect real patterns rather than random variation.
Inferential data analysis includes hypothesis testing, confidence intervals, p-values, effect sizes, statistical significance, sampling error, and generalization.
Common inferential methods include t-tests, ANOVA, chi-square tests, correlation tests, regression models, and nonparametric tests.
For example, a researcher may use inferential analysis to test whether a training program improved employee performance. A healthcare researcher may test whether patients who received an intervention had better outcomes than those who did not. A business analyst may test whether customer satisfaction differs across regions.
A common mistake is reporting p-values without interpretation. A p-value alone does not explain the size, direction, or practical meaning of a result. Strong reporting should explain what was tested, what the result shows, how large the effect is, and what the finding means for the research question or business decision.
4. Comparative Data Analysis
Comparative data analysis is used when the research question asks whether groups differ from each other. It is common in experiments, surveys, program evaluation, healthcare research, education research, and business performance analysis.
Common comparative tests include independent samples t-test, paired samples t-test, one-way ANOVA, repeated measures ANOVA, Mann-Whitney U test, Wilcoxon signed-rank test, and Kruskal-Wallis test.
| Comparison Question | Possible Test |
|---|---|
| Are two independent groups different? | Independent samples t-test |
| Are pre-test and post-test scores different? | Paired samples t-test |
| Are three or more groups different? | One-way ANOVA |
| Are repeated measurements different over time? | Repeated measures ANOVA |
| Are two non-normal groups different? | Mann-Whitney U test |
| Are paired non-normal scores different? | Wilcoxon signed-rank test |
| Are three or more non-normal groups different? | Kruskal-Wallis test |
For example, a company may compare employee engagement scores across three departments using ANOVA. A researcher may compare pre-test and post-test scores using a paired samples t-test. A healthcare analyst may compare patient satisfaction between two independent groups.
The correct test depends on the number of groups, whether observations are independent or paired, variable type, sample size, distribution, and assumptions.
5. Correlational Data Analysis
Correlational data analysis measures the relationship between variables. It helps determine whether two variables move together, how strong the relationship is, and whether the relationship is positive or negative.
Common correlation methods include Pearson correlation and Spearman correlation. Pearson correlation is commonly used when both variables are continuous and approximately normally distributed. Spearman correlation is often used for ordinal data or non-normal relationships.
For example, a business researcher may test whether customer satisfaction is related to repeat purchase intention. A healthcare researcher may examine whether age is associated with recovery time. A marketing analyst may test whether website engagement is related to conversion rate.
Correlation does not prove causation. If two variables are related, it does not mean one causes the other. For example, customer satisfaction may be related to repeat purchase intention, but other factors such as price, product quality, customer support, and brand trust may also influence repeat purchases.
Correlation analysis can support deeper work in Predictive Analytics Services when relationships between variables are used to build forecasting or prediction models.
6. Regression Analysis
Regression analysis is used to estimate relationships between variables and predict outcomes. It is one of the most important quantitative data analysis methods because it can show how one or more independent variables are associated with a dependent variable.
Common types of regression include simple linear regression, multiple regression, logistic regression, ordinal regression, hierarchical regression, mediation analysis, and moderation analysis.
| Regression Type | Use Case |
|---|---|
| Simple linear regression | One predictor and one continuous outcome |
| Multiple regression | Several predictors and one continuous outcome |
| Logistic regression | Binary outcome, such as yes/no or churn/not churn |
| Ordinal regression | Ordered outcome, such as low/medium/high |
| Hierarchical regression | Testing added explanatory value of variable blocks |
| Mediation analysis | Testing whether one variable explains an indirect relationship |
| Moderation analysis | Testing whether a relationship changes under different conditions |
For example, multiple regression can estimate whether customer satisfaction, price perception, and service quality predict loyalty. Logistic regression can predict whether a customer will churn or not churn. Hierarchical regression can test whether adding a new group of variables improves model explanation.
Regression assumptions may include linearity, independence, homoscedasticity, normality of residuals, multicollinearity checks, and model fit. Ignoring these assumptions can lead to weak or misleading conclusions.
7. Predictive Data Analysis
Predictive data analysis uses historical data to estimate future outcomes or classify future cases. It is common in business forecasting, customer analytics, finance, healthcare, marketing, sales, and operations.
Predictive data analysis may include forecasting, classification, regression models, machine learning, model validation, train-test split, accuracy metrics, and business prediction.
Examples include customer churn prediction, sales forecasting, risk scoring, demand forecasting, patient readmission prediction, lead scoring, fraud detection, and inventory planning.
Predictive analysis is different from descriptive reporting. Descriptive analysis explains what happened. Predictive analysis estimates what may happen next. For example, a dashboard may show that churn increased last quarter, while a predictive model may identify which customers are most likely to churn next month.
DataScienceConsultingPro.com supports deeper forecasting and modeling through Predictive Analytics Services and Machine Learning Services.
8. Causal Data Analysis
Causal data analysis examines whether one variable causes a change in another variable. This is more demanding than correlation because causation requires strong research design.
Causal analysis is common in experiments, quasi-experiments, randomized controlled trials, pre-post designs, control group studies, program evaluation, policy research, and treatment effect analysis.
Examples include testing whether a training program improves productivity, whether a healthcare intervention reduces readmissions, or whether a marketing campaign increases conversions.
Causal analysis must consider confounding variables. A confounder is a factor that may influence both the treatment and the outcome. For example, if customers who receive a discount also happen to be more loyal customers, loyalty may affect purchase behavior apart from the discount.
Common causal approaches include randomized experiments, control groups, pre-post comparisons, difference-in-differences, matching, and regression adjustment. Causation should not be claimed from simple correlation. A strong causal claim requires design evidence, not only statistical association.
9. Diagnostic Data Analysis
Diagnostic data analysis investigates why something happened. It is common in business analysis, operations, finance, marketing, customer analytics, program evaluation, and performance management.
Diagnostic analysis helps answer questions such as why sales dropped, why customer churn increased, why satisfaction declined, why operational performance changed, or why a program produced weak outcomes.
Common diagnostic methods include subgroup analysis, cross-tabulation, correlation, regression, root cause analysis, dashboard drill-downs, segmentation, and trend comparison.
For example, if monthly revenue dropped, diagnostic analysis may examine customer segments, product categories, sales channels, pricing changes, traffic sources, conversion rates, and repeat purchases. If employee satisfaction declined, diagnostic analysis may compare departments, tenure groups, workload scores, manager ratings, and compensation perceptions.
Diagnostic analysis often connects with Business Intelligence Services because BI dashboards help teams drill down into performance changes and identify possible causes.
10. Multivariate Data Analysis
Multivariate data analysis examines several variables at the same time. It is useful when research questions involve complex relationships, multiple outcomes, hidden patterns, or groups of related variables.
Common multivariate methods include MANOVA, factor analysis, principal component analysis, cluster analysis, discriminant analysis, multivariate regression, and structural equation modeling.
Factor analysis is often used to identify hidden dimensions in survey items. For example, a customer experience survey may contain 25 items, but factor analysis may reveal underlying dimensions such as service quality, price perception, product satisfaction, and trust.
Principal component analysis can reduce many variables into fewer components. Cluster analysis can group customers or respondents based on similar patterns. MANOVA can compare groups across multiple outcome variables.
Multivariate analysis requires careful planning. The analyst must consider sample size, variable quality, assumptions, interpretation, and whether the results answer the research question.
11. Time Series Analysis
Time series analysis examines data collected over time. It is useful for identifying trends, seasonality, cycles, sudden changes, and forecasting future values.
Time series analysis is common in business performance tracking, finance, sales forecasting, demand planning, website traffic analysis, inventory management, healthcare utilization, and economic research.
Common time series concepts include trend, seasonality, moving averages, forecasting, autocorrelation, and ARIMA-style modeling. Business users may not need to understand every technical detail, but they do need to understand whether a pattern is rising, falling, seasonal, stable, or volatile.
For example, a retail business may use time series analysis to forecast monthly demand. A finance team may use it to forecast cash flow. A marketing team may use it to track website traffic trends before and after campaigns.
Time series analysis becomes stronger when data is collected consistently and measured the same way over time.
12. Survey Data Analysis
Survey data analysis is one of the most common forms of quantitative research. It is used in academic research, customer research, employee research, healthcare research, market research, and program evaluation.
Survey data analysis may include frequencies, percentages, Likert scale analysis, cross-tabulations, reliability analysis, Cronbach’s alpha, factor analysis, group comparisons, regression, correlation, weighting, missing response review, and response bias checks.
For example, a staff satisfaction survey may use descriptive statistics to summarize responses, Cronbach’s alpha to test reliability, factor analysis to identify dimensions, ANOVA to compare departments, and regression to test predictors of satisfaction.
Survey data requires careful handling because many survey items are ordinal, missing responses may be common, and poorly coded variables can create errors. Before analysis, the dataset should be cleaned, labels should be checked, reverse-coded items should be corrected, and missing values should be reviewed.
Types of Quantitative Data and Their Analysis Methods
Different types of quantitative data require different analysis methods. The method used for categorical data may not be suitable for continuous data. The method used for paired measurements may not be suitable for independent groups.
| Data Type | Example | Suitable Analysis |
|---|---|---|
| Nominal | Gender, region, department | Frequencies, percentages, chi-square |
| Ordinal | Satisfaction rating | Median, nonparametric tests, ordinal regression |
| Interval | Standardized score | Mean, standard deviation, t-test, ANOVA |
| Ratio | Revenue, age, time | Mean, regression, correlation |
| Binary | Yes/no, churn/not churn | Frequencies, chi-square, logistic regression |
| Count | Number of visits | Poisson or negative binomial models |
Choosing the correct method begins with identifying the outcome variable. If the outcome is continuous, regression or ANOVA may be suitable. If the outcome is categorical, chi-square or logistic regression may be more appropriate. If the outcome is ordinal, nonparametric tests or ordinal regression may be considered.
How to Choose the Right Data Analysis Method
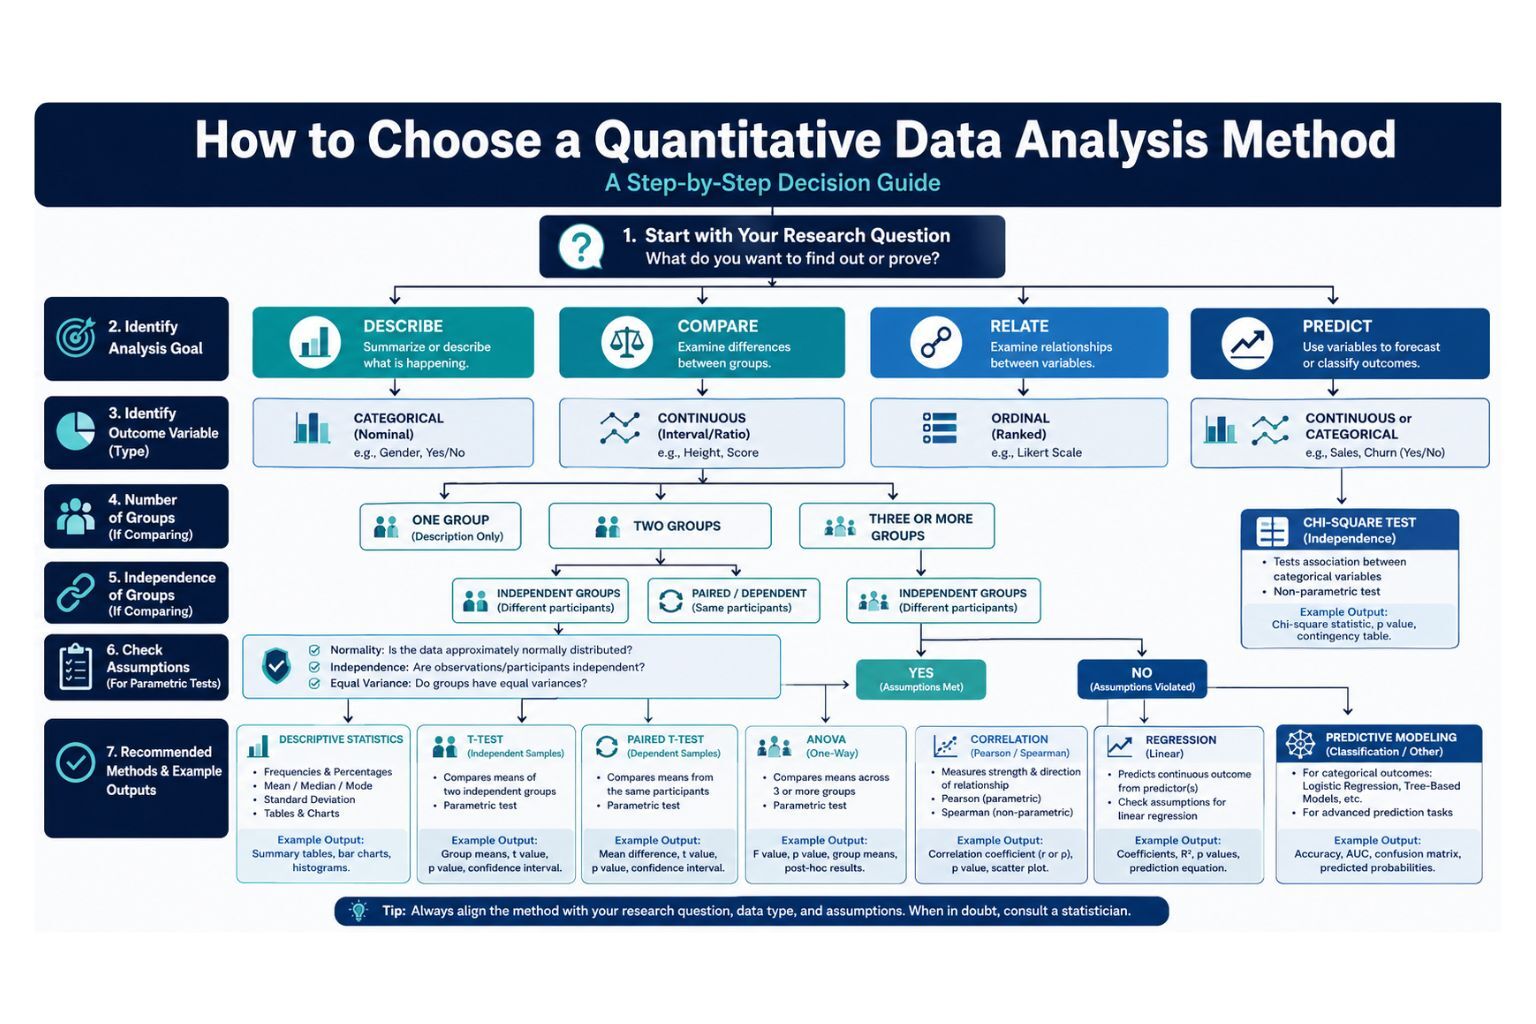
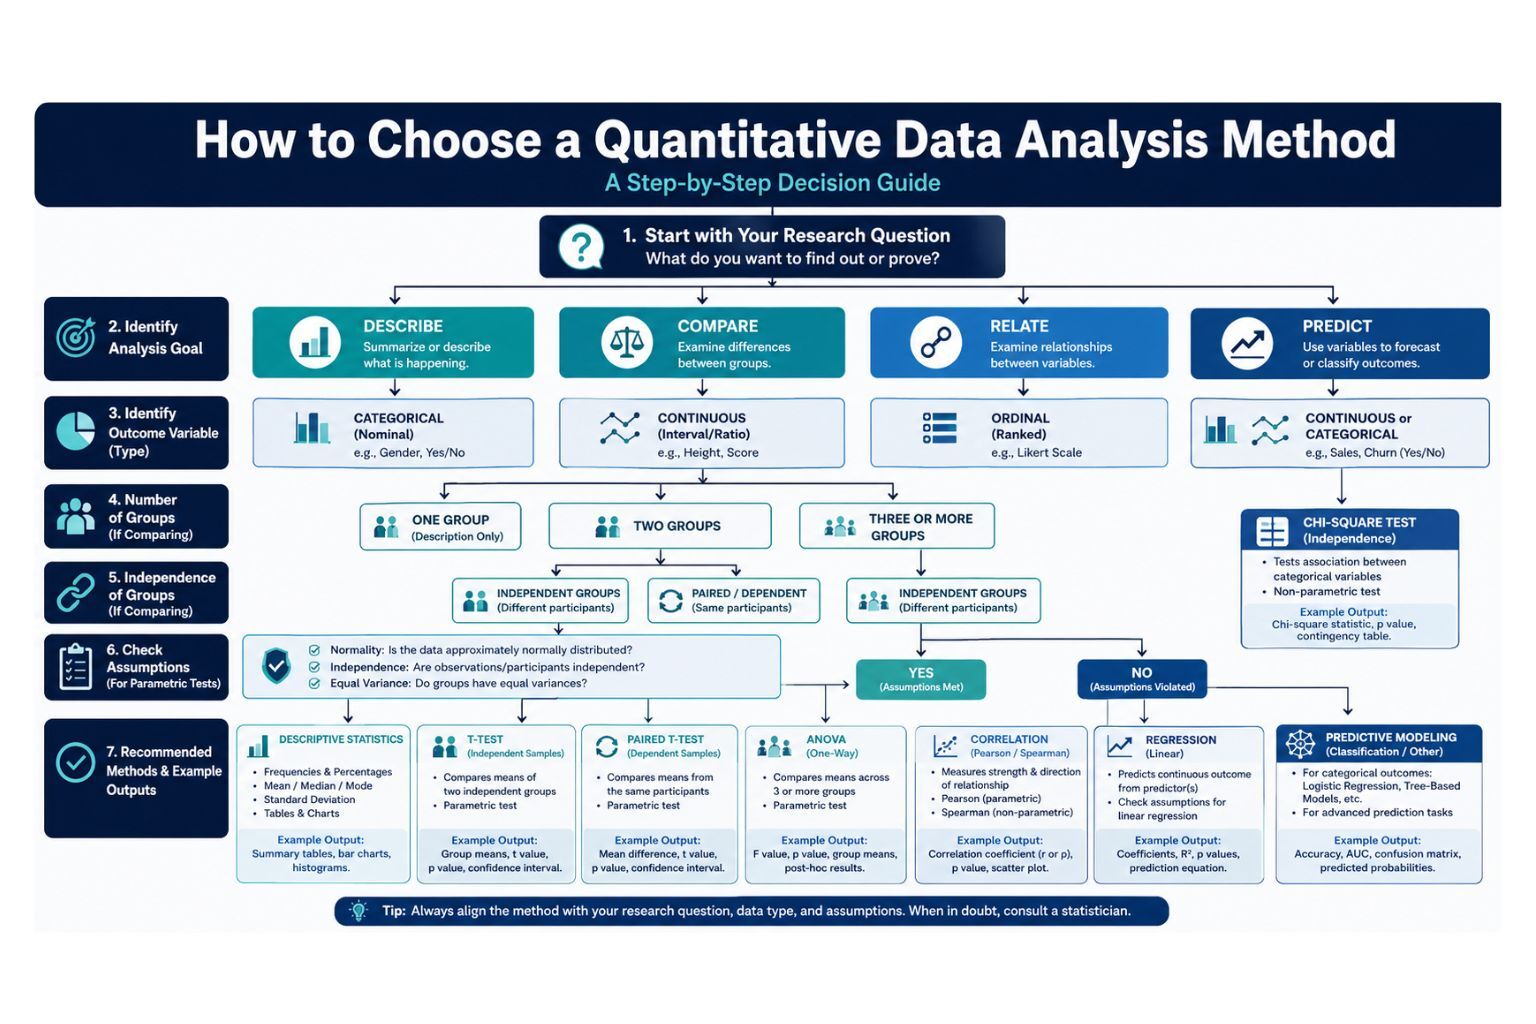
Choosing the right quantitative data analysis method requires a structured decision process. The best method depends on the research question, variable types, number of groups, assumptions, study design, and reporting goal.
Ask these questions before choosing a method:
- What is the research question?
- What is the outcome variable?
- Is the outcome categorical or continuous?
- How many groups are being compared?
- Are observations independent or paired?
- Is the data normally distributed?
- Are you describing, comparing, predicting, or explaining?
- Do you need statistical testing or dashboard reporting?
- Do you need academic reporting or business reporting?
- Are assumptions met?
- Is the sample size suitable?
For example, if you want to compare average satisfaction scores between two independent groups, an independent samples t-test may be appropriate. If you want to compare satisfaction across four departments, ANOVA may be better. If you want to predict churn, logistic regression or machine learning may be suitable.
Key Assumptions in Quantitative Data Analysis
Most quantitative data analysis methods have assumptions. If these assumptions are ignored, results may be unreliable or misleading. Assumption checking is one of the main differences between careful analysis and shallow software output.
Common assumptions include normality, independence of observations, equal variance, linearity, absence of extreme outliers, adequate sample size, and low multicollinearity.
For example, a t-test or ANOVA may require approximately normal data and similar variance across groups. Regression analysis may require linearity, independent errors, homoscedasticity, normality of residuals, and no serious multicollinearity among predictors.
When assumptions are not met, the analyst may use nonparametric tests, transform variables, remove or explain outliers, use robust methods, or choose a different model. This is why method selection should happen after data review, not before.
Assumptions should not be treated as a checklist only. They should be connected to the research question, sample size, variable type, and reporting goal. A small violation may not always destroy an analysis, but a serious violation can change the correct method and interpretation.
Quantitative Data Analysis Tools
Quantitative data analysis can be performed using several tools. The best tool depends on project complexity, analysis method, automation needs, reporting requirements, and user skill level.
| Tool | Best For | Limitation |
|---|---|---|
| Excel | Basic summaries and charts | Limited for advanced statistics |
| SPSS | Academic statistical analysis | Less flexible for automation |
| R | Advanced statistics and visualization | Requires coding |
| Python | Automation, machine learning, large datasets | Requires programming skill |
| Stata | Econometrics and applied research | Paid software |
| SAS | Enterprise analytics | Expensive and complex |
| Power BI | Dashboards and business reporting | Not mainly for advanced statistics |
| Tableau | Visual analytics | Requires clean data |
| SQL | Data extraction and transformation | Not a full statistical tool |
Excel is useful for basic analysis, but it may not be enough for complex research. SPSS is popular for academic research because it is menu-driven and supports many standard statistical tests. R and Python are powerful for advanced statistics, automation, machine learning, and reproducible workflows. Power BI and Tableau are useful when analysis results need to become dashboards or business reports.
Trust and Quality in Quantitative Data Analysis
Reliable quantitative data analysis depends on more than running software. The dataset must be cleaned, variables must be coded correctly, assumptions must be checked, and the selected method must match the research question. Results should also be interpreted clearly rather than copied directly from SPSS, R, Python, Excel, or another tool.
At DataScienceConsultingPro.com, quality analysis focuses on accuracy, transparency, confidentiality, and decision-ready reporting. This includes checking missing values, reviewing outliers, validating variable labels, confirming measurement levels, documenting analysis steps, and explaining what the results mean in plain language.
Strong quantitative reporting should answer four questions:
- What was tested?
- What method was used?
- What did the results show?
- Why does it matter for the research question or business decision?
Trust also depends on confidentiality and careful handling of data. Research datasets, customer records, survey responses, healthcare information, employee data, and financial data should be treated with care. A professional analysis workflow should protect sensitive information and present results clearly without exposing unnecessary details.
Common Mistakes in Quantitative Data Analysis
Common mistakes in quantitative data analysis can weaken results even when the dataset looks complete. The most frequent problems include analyzing dirty data, using the wrong statistical tests, ignoring assumptions, treating ordinal data incorrectly, and reporting p-values without interpretation.
Other mistakes include ignoring effect sizes, confusing correlation with causation, using too many tests without purpose, overfitting predictive models, copying raw software output, creating weak visualizations, failing to document steps, and not checking reproducibility.
For example, reporting that a result is statistically significant is not enough. A strong report should explain what changed, how large the change was, whether the result is practically meaningful, and what limitations apply.
In business analysis, a common mistake is creating dashboards before cleaning and validating the data. This can make reports look professional while still showing inaccurate numbers.
Quantitative Data Analysis Pricing
Quantitative data analysis pricing depends on dataset size, number of variables, data cleaning needs, analysis complexity, number of hypotheses, software required, deadline, reporting depth, visualization requirements, academic or business reporting needs, dashboard needs, and predictive modeling requirements.
A small descriptive analysis project usually costs less than a full survey analysis, regression modeling project, or predictive analytics project. A dataset with missing values, poor coding, inconsistent labels, or many variables may require more preparation before analysis begins.
| Package | Best For | Includes |
|---|---|---|
| Basic Quantitative Analysis | Small datasets and simple summaries | Data cleaning, descriptive statistics, charts |
| Statistical Testing Package | Academic or research hypotheses | t-tests, ANOVA, chi-square, correlation, regression |
| Survey Analysis Package | Survey and questionnaire data | Frequencies, Likert analysis, reliability, cross-tabs |
| Advanced Quantitative Analysis | Complex research projects | Regression, factor analysis, multivariate tests |
| Predictive Analysis Package | Business or forecasting projects | Predictive modeling, validation, interpretation |
| Dashboard Reporting Package | Business reporting and KPIs | Data preparation, dashboard design, reporting visuals |
The best way to price a quantitative analysis project is to review the dataset, research questions, number of variables, expected tests, reporting style, and deadline. A clear scope helps avoid underestimating the work needed for cleaning, testing, visualization, and interpretation.
Request a quantitative data analysis quote and we will review your dataset, research questions, variables, deadline, and reporting requirements.
.
When to Hire a Quantitative Data Analysis Consultant
Hiring a quantitative data analysis consultant is useful when the analysis affects important decisions, academic reporting, business strategy, or professional research quality.
You may need support when you are unsure which test to use, the dataset is messy, there are many variables, academic reporting is required, business decisions depend on the results, predictive modeling is needed, survey data requires reliability or factor analysis, charts and dashboards are required, or results must be interpreted clearly.
A consultant can help with method selection, data cleaning, assumption checking, statistical testing, interpretation, visualization, and reporting. This reduces the risk of using the wrong test or presenting results that are technically correct but poorly explained.
DataScienceConsultingPro.com provides Data Analysis Services for researchers, organizations, and businesses that need accurate quantitative analysis and clear reporting.
How DataScienceConsultingPro.com Can Help
DataScienceConsultingPro.com helps with data cleaning, quantitative data analysis, statistical testing, survey data analysis, regression analysis, predictive analytics, dashboard reporting, business intelligence, and interpretation.
We work with tools such as Python, R, SPSS, Excel, Power BI, Tableau, and SQL. Depending on your project, we can help prepare your dataset, select the right statistical method, run the analysis, interpret results, create charts, build dashboards, or prepare a decision-ready report.
Need help choosing the right type of quantitative data analysis? Request a Data Analysis Services quote from DataScienceConsultingPro.com today.
FAQs About Types of Data Analysis in Quantitative Research
The main types include descriptive, exploratory, inferential, comparative, correlational, regression, predictive, causal, diagnostic, multivariate, time series, and survey data analysis.
Descriptive data analysis summarizes a dataset using frequencies, percentages, mean, median, mode, range, standard deviation, tables, and charts.
Inferential data analysis uses sample data to make conclusions about a wider population through hypothesis testing, confidence intervals, p-values, and statistical models.
Exploratory data analysis inspects data before formal testing. It checks missing values, outliers, distributions, unusual values, and early patterns.
Predictive data analysis uses historical data to forecast future outcomes or classify future cases, such as churn prediction, sales forecasting, and risk scoring.
Descriptive statistics summarize what is in the dataset. Inferential statistics use sample data to test hypotheses or estimate population-level patterns.
The correct test depends on the research question, variable type, number of groups, study design, distribution, assumptions, and reporting goal.
Use a t-test when comparing the mean of two groups or comparing paired measurements such as pre-test and post-test scores.
Use ANOVA when comparing means across three or more groups or repeated measurements, depending on the study design.
Use chi-square when testing association between categorical variables, such as gender and purchase category or department and satisfaction level.
Use correlation analysis when measuring the strength and direction of a relationship between two variables.
Use regression analysis when you want to estimate relationships, explain variation, or predict an outcome using one or more predictors.
Survey data analysis examines questionnaire responses using descriptive statistics, reliability analysis, cross-tabulations, correlations, group comparisons, regression, and visualization.
Excel works for basic summaries, SPSS is common for academic research, R and Python are powerful for advanced analysis, SQL helps with data extraction, and Power BI or Tableau support dashboards.
Cost depends on dataset size, number of variables, data cleaning needs, statistical complexity, software, deadline, reporting depth, visualization needs, and whether predictive modeling or dashboards are required.
Hire a consultant when you are unsure which method to use, the dataset is messy, the project has many variables, reporting must be accurate, or decisions depend on the results.
Yes. DataScienceConsultingPro.com can support quantitative data analysis using SPSS, R, Python, Excel, Power BI, SQL, Tableau, and other analysis tools.
Yes. Quantitative data analysis supports business decisions through performance tracking, customer analytics, forecasting, pricing analysis, churn prediction, dashboard reporting, and operational analysis.
Choose the Right Quantitative Data Analysis Method
The right type of quantitative data analysis depends on the research question, data type, study design, assumptions, and decision goal. Descriptive analysis summarizes data, exploratory analysis checks patterns and data quality, inferential analysis tests hypotheses, comparative analysis examines group differences, correlation measures relationships, regression estimates predictors, and predictive analytics supports forecasting.
Good quantitative data analysis is not only about running software. It requires clean data, correct method selection, assumption checking, clear interpretation, useful visuals, and reporting that connects results to the research or business question.
DataScienceConsultingPro.com helps researchers, businesses, and organizations with data cleaning, statistical testing, regression, survey analysis, predictive modeling, dashboards, and reporting.
Request a Data Analysis Services quote today and get expert help choosing, running, interpreting, and reporting the right quantitative data analysis method.
