Learn the Tools, See Examples, and Turn Data Into Business Insights
Python for Data Analysis is one of the most practical ways to turn messy spreadsheets, SQL exports, survey responses, customer records, and business reports into clear answers. Many people do not need Python just because they want to write code. They need Python because they have raw data sitting in Excel, CSV files, databases, or business platforms, and they need to understand what the numbers are saying.
Python helps clean data, organize information, find patterns, create charts, automate reports, and support better decisions. It is used by business owners, analysts, researchers, students, startup teams, marketers, finance teams, and operations managers who want to move from scattered data to useful insight.
A company may have 12 months of sales data but no clear answer on which products, regions, or customer segments are driving profit. A student may have survey responses but needs clean tables, charts, and statistical summaries. A founder may have customer usage data but needs to understand churn, revenue patterns, and growth opportunities. Python can help with all of these problems.
This guide explains what Python for data analysis means, which tools to learn, how to use Python step by step, how it compares with R and SQL, which books and courses are useful, and when a real project may need professional support.
Have data but not clear answers? Request a Quote and share your file type, project goal, deadline, and the kind of output you need.
What Is Python for Data Analysis?
Python for data analysis means using the Python programming language to collect, clean, organize, summarize, visualize, and interpret data. Instead of manually sorting spreadsheets or copying numbers into reports, Python allows you to create repeatable workflows that can handle small, medium, and large datasets.
At a basic level, Python can help you open a file, inspect columns, remove missing values, calculate averages, group records, and create charts. At a more advanced level, Python can connect to SQL databases, automate reports, run statistical models, build predictive models, and prepare data for machine learning.
Python is popular because it is readable, flexible, and supported by powerful libraries such as pandas, NumPy, Matplotlib, Seaborn, SciPy, scikit-learn, and Jupyter Notebook. These tools make it possible to work with real data without building every analysis function from scratch.
For example, Python can help answer questions like:
- Which product category generates the most revenue?
- Which customers are most likely to leave?
- Which marketing campaign has the best return?
- Which survey responses support a research hypothesis?
- Which region, team, or service line is underperforming?
- What trends are visible in monthly business performance?
Python does not replace business thinking. It supports business thinking by making the data easier to clean, analyze, and explain.
Why This Guide Matters for Real Data Projects
Real data projects often fail because the dataset is messy, the question is unclear, or the results are not interpreted properly. A Python script can produce tables and charts, but the real value comes from asking the right question, cleaning the data correctly, choosing the right method, and explaining the results in a way that non-technical readers can understand.
A strong Python analysis should be reproducible. This means the steps are documented clearly enough that the analysis can be reviewed, repeated, or updated later. Reproducibility is especially important for business reports, dissertation projects, investor presentations, dashboards, and recurring performance reviews.
A strong analysis should also be responsible. Sensitive data should be handled carefully, unnecessary columns should be removed when possible, and results should not be exaggerated. Good data analysis explains what the data shows, what it does not show, and what limitations may affect the interpretation.
That is why Python for data analysis is not only a coding skill. It is also a decision-making skill.
Why Python Is One of the Best Tools for Data Analysis
Python is widely used for data analysis because it combines beginner-friendly syntax with advanced analytical power. A beginner can start with simple commands, while an experienced analyst can use Python for automation, reporting, statistics, dashboards, and machine learning.
One of Python’s biggest advantages is that it works with many common data sources. You can import Excel files, CSV files, Google Sheets exports, SQL databases, API data, CRM records, website analytics exports, accounting data, and survey responses. This makes Python useful across business, academic, nonprofit, healthcare, finance, real estate, marketing, and operations projects.
Python is also useful because it supports repeatable analysis. If a company needs the same report every week or month, Python can automate the cleaning, calculations, and visualizations. This reduces manual work and lowers the risk of spreadsheet errors.
Another strength is visualization. After cleaning and summarizing the data, Python can create charts that show trends, relationships, outliers, and performance differences. These visuals can support business reports, academic results sections, investor updates, internal dashboards, and executive summaries.
Python also creates a path toward more advanced work. Even if your current goal is simple data analysis, learning Python can later help with regression, classification, clustering, forecasting, predictive analytics, and machine learning.
Have a messy spreadsheet, SQL export, or survey dataset? Data Science Consulting Pro can help you turn it into a clean Python analysis, charts, and decision-ready insights. For broader project support, review Data Analysis Services.
Key Python Libraries for Data Analysis
Python becomes powerful for data analysis because of its libraries. A library is a collection of ready-made tools that helps you perform specific tasks. For data analysis, the most important libraries include pandas, NumPy, Matplotlib, Seaborn, SciPy, scikit-learn, Jupyter Notebook, and database connectors.
| Library | Main Use | Best For | Example Output |
|---|---|---|---|
| pandas | Data cleaning and manipulation | Tables, Excel, CSV, business data | Cleaned data, grouped summaries |
| NumPy | Numerical computing | Arrays, calculations, formulas | Fast mathematical operations |
| Matplotlib | Basic visualization | Line charts, bar charts, scatter plots | Custom charts |
| Seaborn | Statistical visualization | Pattern discovery and cleaner charts | Heatmaps, boxplots, trend charts |
| SciPy | Scientific and statistical computing | Tests, distributions, optimization | Statistical test results |
| scikit-learn | Machine learning | Regression, classification, clustering | Predictive model output |
| Jupyter Notebook | Interactive coding and documentation | Learning, reporting, reproducibility | Analysis notebook |
| SQLAlchemy/database connectors | Database connection | SQL and Python workflows | Database-to-report pipeline |
pandas
pandas is the main Python library for working with structured data. If your dataset looks like a spreadsheet with rows and columns, pandas is usually the first library you will use.
With pandas, you can import files, rename columns, remove duplicates, filter rows, group data, merge datasets, create pivot-style summaries, calculate new fields, and export cleaned results. It is one of the most important tools to learn if you want to use Python for data analysis.
For example, if you have a sales file with customer names, dates, regions, products, and revenue, pandas can calculate revenue by region, average order value, best-selling products, and monthly sales trends.
NumPy
NumPy is used for numerical computing. It works with arrays, mathematical functions, and fast calculations. Many other Python libraries are built on top of NumPy.
For basic business analysis, you may not use NumPy directly every day, but it is still important because it supports the calculations behind pandas, SciPy, and scikit-learn.
Matplotlib
Matplotlib is one of the most common Python libraries for creating charts. It can create bar charts, line charts, scatter plots, histograms, and many other visualizations.
Matplotlib is useful when you need control over chart formatting. For example, you might use it to create a monthly revenue trend chart or compare sales across different product categories.
Seaborn
Seaborn is built on top of Matplotlib and is often used for statistical visualization. It makes it easier to create cleaner charts such as heatmaps, boxplots, pair plots, and regression plots.
Seaborn is helpful during exploratory data analysis because it helps reveal patterns between variables. For example, it can show whether customer age, subscription length, purchase frequency, or support tickets are related to churn.
SciPy
SciPy supports scientific and statistical computing. It can be used for hypothesis testing, probability distributions, optimization, and advanced mathematical operations.
Students, researchers, and analysts may use SciPy when a project requires statistical testing or research-based analysis. If the project involves hypotheses, regression interpretation, survey data, or formal research methodology, review Statistical Analysis Services for deeper support.
scikit-learn
scikit-learn is one of the most popular Python libraries for machine learning. It supports regression, classification, clustering, model evaluation, preprocessing, and feature engineering.
For example, scikit-learn can help predict customer churn, classify leads, estimate sales, forecast risk, or segment customers. If your project moves beyond basic analysis into model building, review Machine Learning Services.
Jupyter Notebook
Jupyter Notebook allows you to write code, display outputs, explain your steps, and show charts in one place. This makes it useful for learning, academic work, business reporting, and reproducible analysis.
A Jupyter Notebook can show the full journey from raw data to cleaned data, charts, interpretation, and recommendations.
SQLAlchemy and Python Database Connectors
Many real business datasets are stored in databases. Python can connect to databases using SQLAlchemy, sqlite3, psycopg2, pyodbc, and other connectors.
This allows analysts to extract data with SQL, clean it with pandas, visualize it with Python, and turn it into a report. SQL and Python for data analysis is one of the strongest combinations for business intelligence, reporting, and analytics work.
How to Use Python for Data Analysis: Step-by-Step Workflow
Using Python for data analysis is not just about writing code. A strong analysis follows a clear process. The goal is to move from a question to a reliable answer.
Step 1: Define the Business or Research Question
Every good analysis begins with a question. For example:
- Which products are driving the most profit?
- Why are customers cancelling subscriptions?
- Which campaign produced the highest return?
- What factors predict student performance?
- Is there a relationship between customer satisfaction and repeat purchases?
Without a clear question, it is easy to create charts that look interesting but do not help anyone make a decision.
Step 2: Collect the Data
Data may come from Excel files, CSV files, SQL databases, APIs, surveys, CRMs, accounting systems, website analytics tools, or customer support platforms.
Before importing the data into Python, it helps to understand what each column means, where the data came from, and whether the file includes sensitive information.
Step 3: Import the Data Into Python
Most beginners start by importing a CSV or Excel file using pandas.
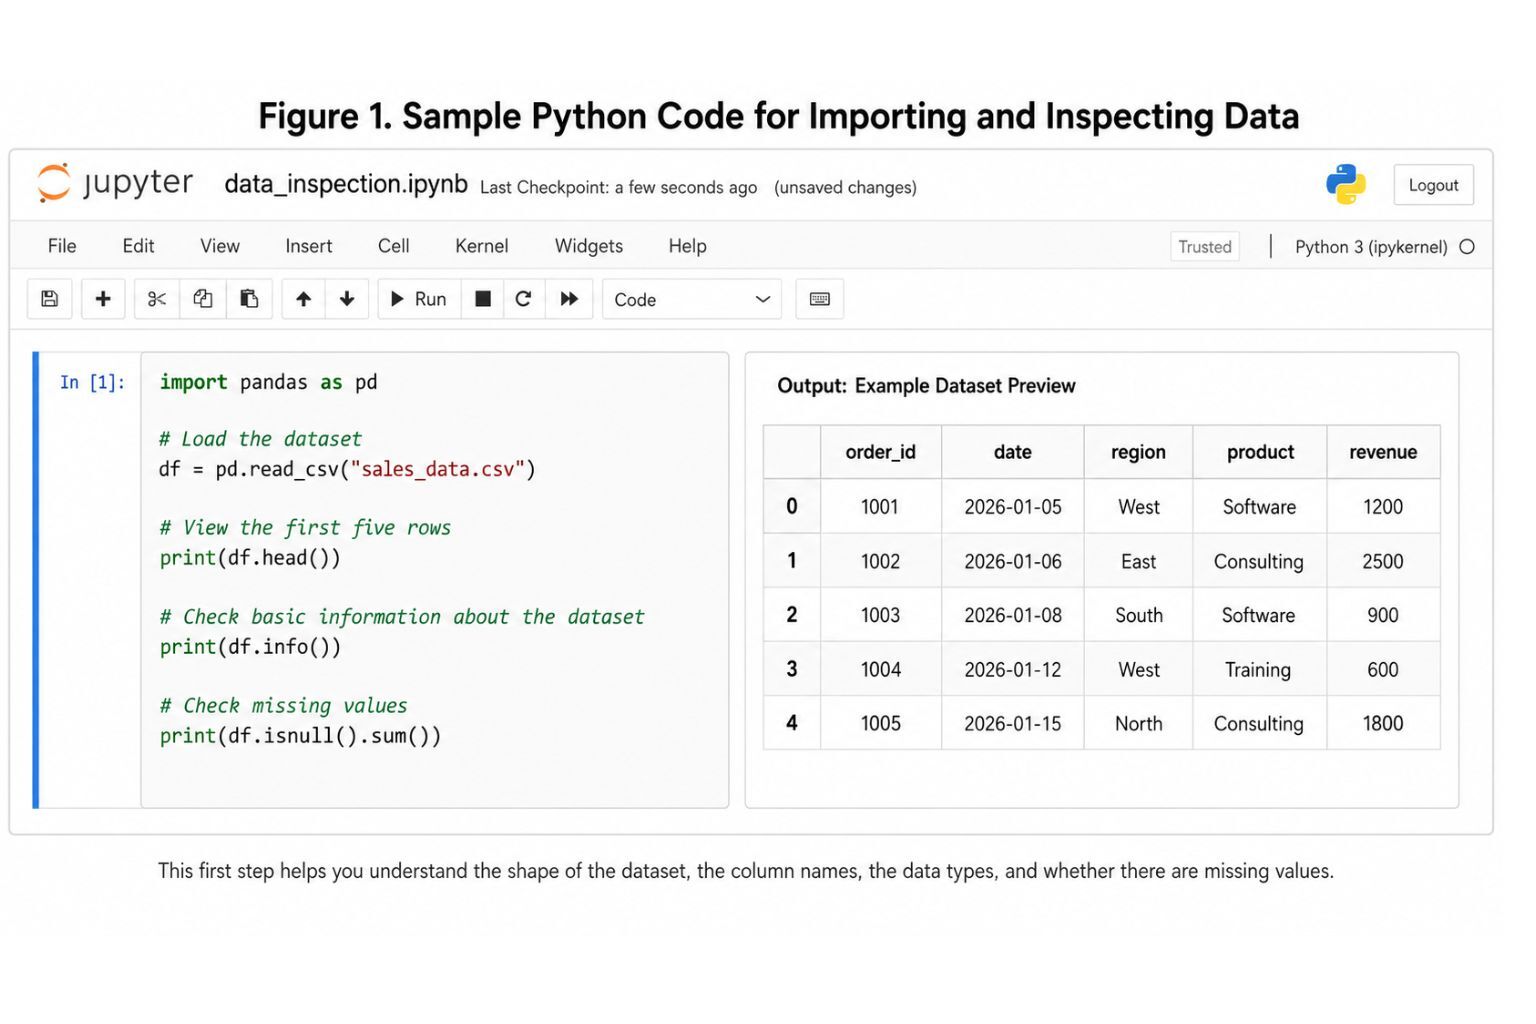
Step 4: Clean the Dataset
Data cleaning is often the most time-consuming part of analysis. Real datasets may include missing values, duplicate rows, inconsistent dates, spelling issues, blank columns, incorrect data types, and outliers.
For example, a region column may include “NY,” “New York,” and “new york” as separate values even though they mean the same thing. A revenue column may be stored as text instead of numbers. A date column may use different formats.
When the dataset is very messy, Data Cleaning Services can explain the deeper process, pricing, and service details without making this blog compete with that page.
Step 5: Create Summary Statistics
Summary statistics help you understand the data at a high level. You may calculate counts, averages, medians, maximum values, minimum values, and standard deviations.
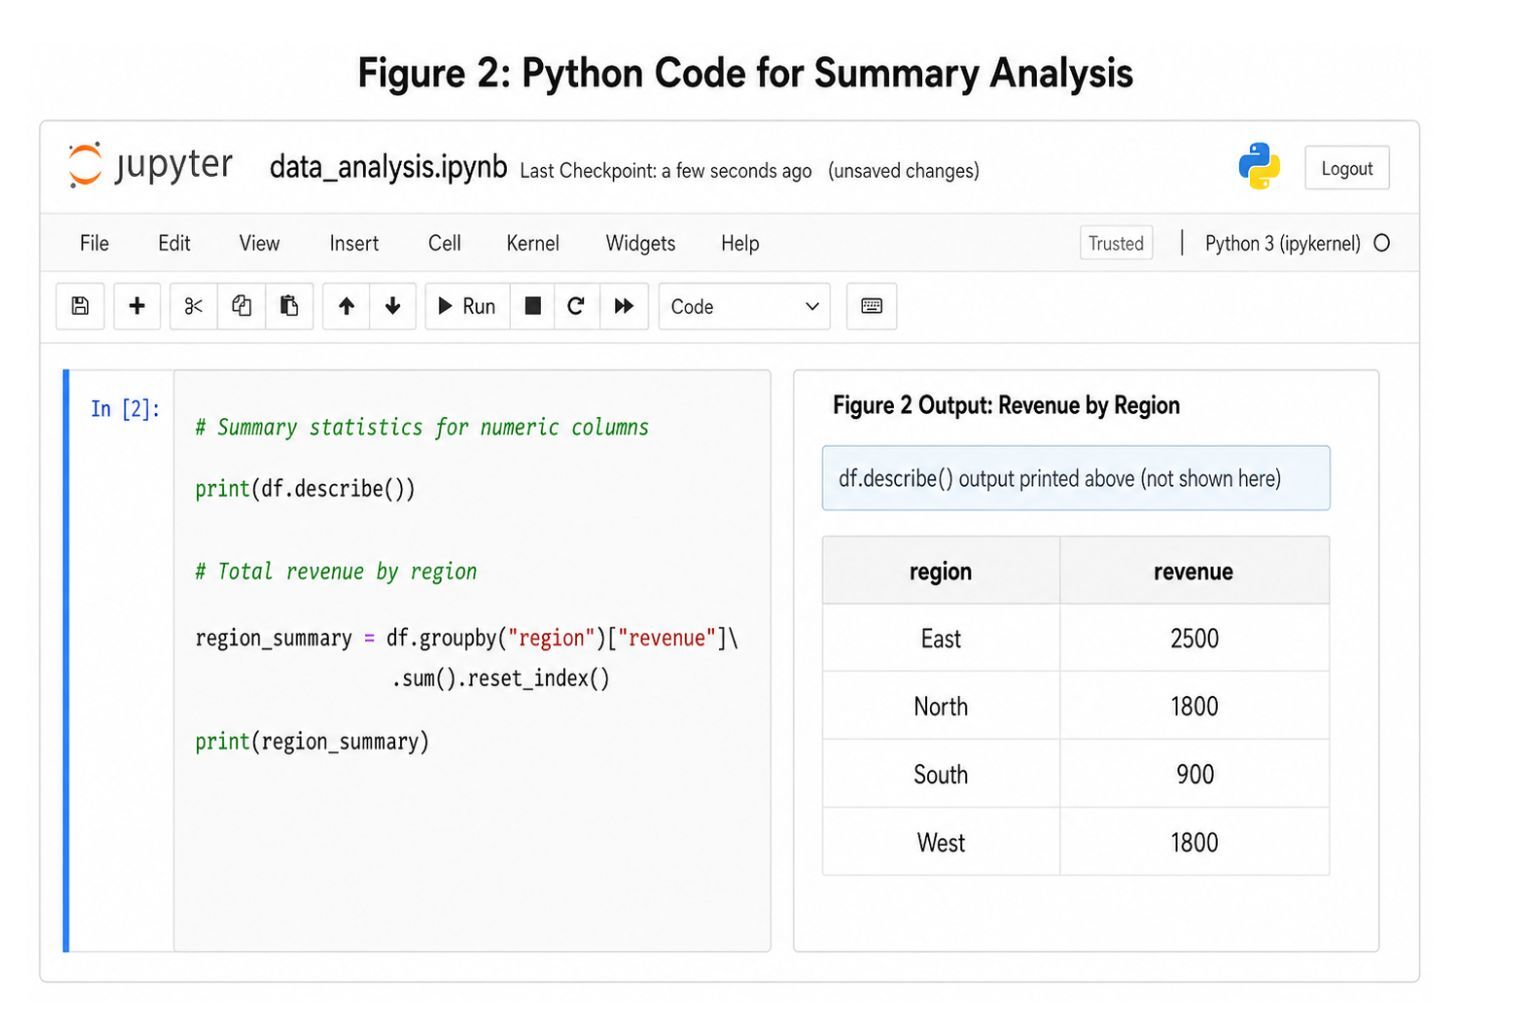
This output already gives a useful insight. The East region has the highest revenue in this small example.
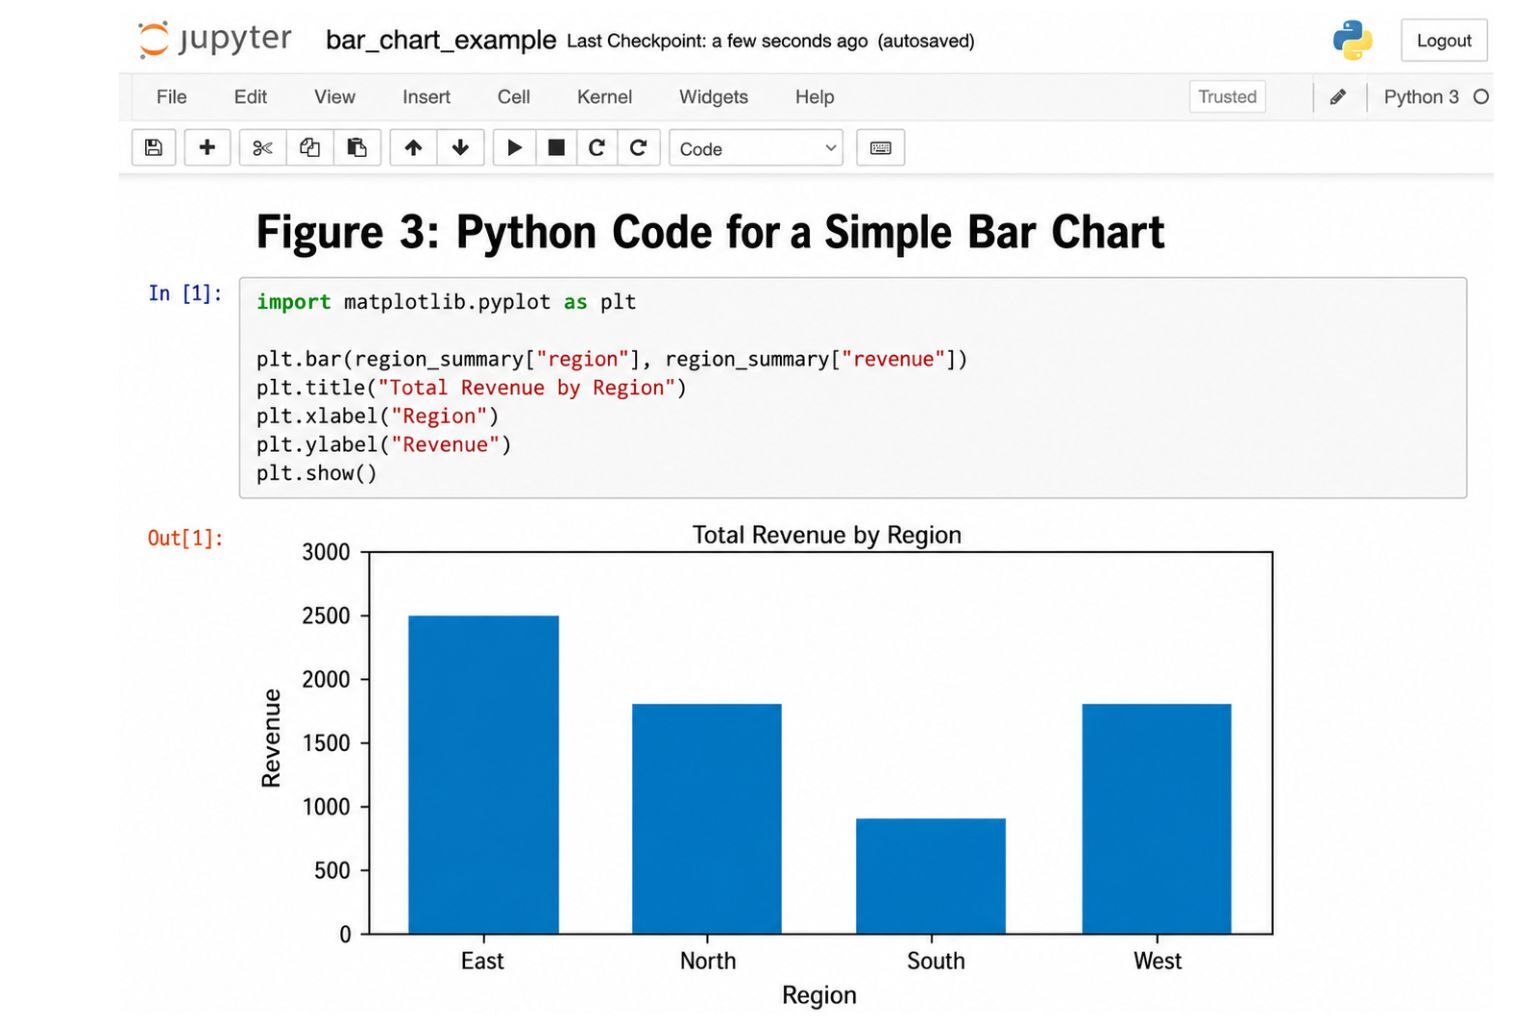
Step 6: Visualize Patterns
Charts make it easier to communicate findings. A table may show numbers, but a chart helps readers see differences quickly.
If you want this type of analysis turned into a visual reporting system, review Dashboard Development Services..
Step 7: Interpret the Results
Python can calculate the numbers, but the analyst must explain what the results mean.
Example interpretation:
“The East region generated the highest revenue, mainly because consulting sales were stronger there. The South region had the lowest revenue, so the company may need to review sales coverage, pricing, or lead generation in that territory.”
Interpretation is what turns data analysis into decision support.
Step 8: Build a Report or Recommendation
The final output may be a notebook, PDF report, Excel file, dashboard, slide deck, or executive summary. The best format depends on the audience.
A technical team may want code and documentation. A business owner may want charts and recommendations. A professor may want methodology and statistical interpretation. An executive may want KPIs, trends, risks, and action steps.
Practical Python for Data Analysis Examples
Python can be used across many industries and project types. These examples show how Python turns raw data into usable insight.
Sales Performance Analysis
A sales manager may want to know which products, regions, or sales reps are producing the most revenue. The dataset may include order date, customer name, product, region, salesperson, revenue, and discount.
Python can calculate total revenue, monthly sales trends, average deal size, conversion rate, product performance, and regional performance. The final output may include a sales report, trend chart, and recommendations for improving low-performing areas.
This blog should stay educational. A dedicated sales analytics package or full analysis service page should handle the deeper commercial details.
Customer Churn Analysis
Customer churn analysis helps a business understand why customers leave. The dataset may include customer tenure, subscription type, usage level, support tickets, payment history, satisfaction score, and churn status.
Python can identify patterns between churn and customer behavior. For example, customers with low usage and many support tickets may be more likely to cancel. A beginner analysis may use pandas and charts, while a more advanced project may use scikit-learn to build a churn prediction model.
Financial Data Analysis
Python can help analyze revenue, expenses, profit margins, cash flow, and financial performance over time. A business owner may use Python to compare monthly revenue, identify cost increases, or track profit by service line.
The final output may include financial summaries, charts, and variance analysis. Python can also automate recurring financial reports when data is updated monthly.
Marketing Campaign Analysis
Marketing teams can use Python to analyze campaign performance across Google Ads, Meta Ads, email, SEO, social media, and other channels.
The dataset may include impressions, clicks, conversions, cost, revenue, and campaign name. Python can calculate cost per click, conversion rate, cost per acquisition, return on ad spend, and campaign-level profitability.
If the project focuses on website traffic, user behavior, digital campaigns, or marketing performance, review Digital Analytics Services.
Survey or Dissertation Data Analysis
Students and researchers can use Python to clean survey data, calculate descriptive statistics, create visualizations, and run statistical tests.
For example, a dissertation project may involve Likert-scale survey responses, demographic variables, and research hypotheses. Python can support data cleaning and summary analysis, but statistical methods require careful interpretation.
For research-heavy projects, review Dissertation Data Analysis Help or Statistical Analysis Services.
Healthcare or Operations Analysis
Healthcare and operations teams may use Python to analyze appointment volumes, wait times, staffing patterns, patient satisfaction, inventory levels, or operational bottlenecks.
For example, Python can show which days have the longest wait times or which service categories create the highest workload. The final output may support staffing decisions, scheduling improvements, or process redesign.
Real Estate or Airbnb Revenue Analysis
Python can help analyze occupancy, average daily rate, cleaning fees, monthly revenue, booking source, and seasonal trends.
A short-term rental operator may use Python to compare revenue by month, identify high-demand periods, evaluate pricing performance, or estimate the impact of occupancy changes.
SQL Database Analysis Using Python
Many companies store data in SQL databases. Python can connect to the database, run a query, clean the results, and generate charts or reports.
Learn Python for Data Analysis: Beginner-to-Advanced Roadmap
If you want to learn Python for data analysis, the best approach is to move in stages. Do not start with machine learning immediately. First, learn how to work with basic data structures, clean files, and interpret simple results.
| Learning Stage | Skills to Learn | Example Project |
|---|---|---|
| Beginner | Python basics, variables, lists, dictionaries, loops, functions | Clean a small CSV file |
| Early Data Analysis | pandas, NumPy, importing Excel/CSV files | Analyze monthly expenses |
| Intermediate | Missing values, grouping, filtering, visualization | Sales performance report |
| Advanced | SQL, APIs, statistics, regression, dashboards | Customer churn analysis |
| Portfolio | GitHub, case studies, reports, dashboards | Business analytics portfolio |
Beginner Level
Start with Python basics. Learn variables, strings, numbers, lists, dictionaries, loops, functions, and basic file handling. Then move into Jupyter Notebook because it allows you to write code and explain your work in one place.
At this stage, the goal is not to memorize everything. The goal is to become comfortable reading and modifying simple code.
Intermediate Level
The intermediate stage is where Python becomes useful for real analysis. Learn pandas, NumPy, data cleaning, missing values, grouping, filtering, sorting, merging datasets, and creating charts.
You should practice with realistic datasets such as sales records, survey responses, customer lists, inventory data, financial reports, or website traffic exports.
Advanced Level
At the advanced level, learn SQL and Python for data analysis, API data collection, statistical analysis, regression, dashboards, report automation, and machine learning basics.
This is where Python becomes more than a learning tool. It becomes a practical system for repeatable reporting and decision support.
Portfolio Level
A strong portfolio should include 3–5 real projects. Examples include a sales analysis, customer churn analysis, financial dashboard, marketing campaign analysis, and survey research project.
Each project should explain the problem, dataset, methods, visuals, findings, and recommendations.
Python for Data Analysis Course: Free vs Paid Options
A Python for data analysis course can be a good starting point, especially for beginners who need structure. Free courses are useful when you are exploring the field, learning basic syntax, or practicing with guided examples.
A free Python for data analysis course may be enough if your goal is to understand the basics, build confidence, or complete beginner exercises. However, free courses often have limitations. They may not teach you how to handle messy real-world data, explain business context, or create polished reports.
Paid courses may offer more structure, assignments, certificates, and guided projects. University courses may provide academic depth. Books may provide stronger technical explanations. Professional consulting help is better when you already have a real dataset, a deadline, and a specific outcome you need.
| Option | Best For | Pros | Limitations |
|---|---|---|---|
| Free course | Beginners exploring Python | No cost, easy to start | May lack depth and feedback |
| Paid course | Structured learners | Guided path and projects | May still use clean practice data |
| University course | Academic learners | Formal curriculum | May be slower or less practical |
| Book-based learning | Deep technical learning | Strong explanations | Requires discipline |
| One-on-one tutoring | Personalized learning | Direct feedback | Can be expensive |
| Professional project help | Real datasets and deadlines | Practical deliverables | Best when scope is clear |
Courses teach you skills. Real projects test whether you can apply those skills to messy data, unclear questions, and deadline pressure.
Python for Data Analysis Book: Is Wes McKinney’s Book Worth It?
Many people searching for this topic also search for the Python for Data Analysis Wes McKinney book. Wes McKinney is strongly associated with pandas, one of the most important Python libraries for data analysis.
Python for Data Analysis by Wes McKinney is especially useful for learning pandas, NumPy, data wrangling, data cleaning, transformation, time series, and practical workflows. The Python for Data Analysis 3rd Edition Wes McKinney book is a strong resource for readers who want deeper technical understanding rather than only short tutorials.
A course may be better if you want guided lessons and exercises. A book may be better if you want depth and reference material. A consultant or analyst may be better if you have a real dataset, need a report, or cannot afford to spend weeks learning before making a decision.
Many users also search for “wes mckinney python for data analysis pdf” or “python for data analysis pdf.” It is important to use legitimate sources. Avoid unauthorized PDF downloads. Use official open-access versions, publisher pages, libraries, or authorized e-book platforms. Ethical data professionals should respect copyright and use trusted sources.
R vs Python for Data Analysis
The phrase “R vs Python for data analysis” is common because both tools are powerful. The best choice depends on your goals.
| Feature | Python | R | Best Choice |
|---|---|---|---|
| Beginner learning curve | Easier for general programming | Easier for some statistical users | Python for general beginners |
| Data cleaning | Very strong with pandas | Strong with tidyverse | Both |
| Statistical analysis | Strong | Excellent | R for specialized statistics |
| Machine learning | Very strong | Strong | Python |
| Visualization | Strong | Excellent | R for statistical plots, Python for flexible workflows |
| Business automation | Excellent | Limited compared with Python | Python |
| Academic research | Strong | Excellent | Depends on field |
| Dashboard/reporting | Strong | Strong | Both |
| Career demand | Very strong across analytics, data science, engineering | Strong in statistics and research | Python for broader roles |
| App/database integration | Excellent | More limited | Python |
R is excellent for statistics, academic research, and specialized statistical packages. Python is often better for automation, machine learning, business analytics, software integration, dashboards, and scalable workflows.
For many business users, Python is the better long-term choice because it connects analysis with automation, databases, APIs, machine learning, and reporting systems.
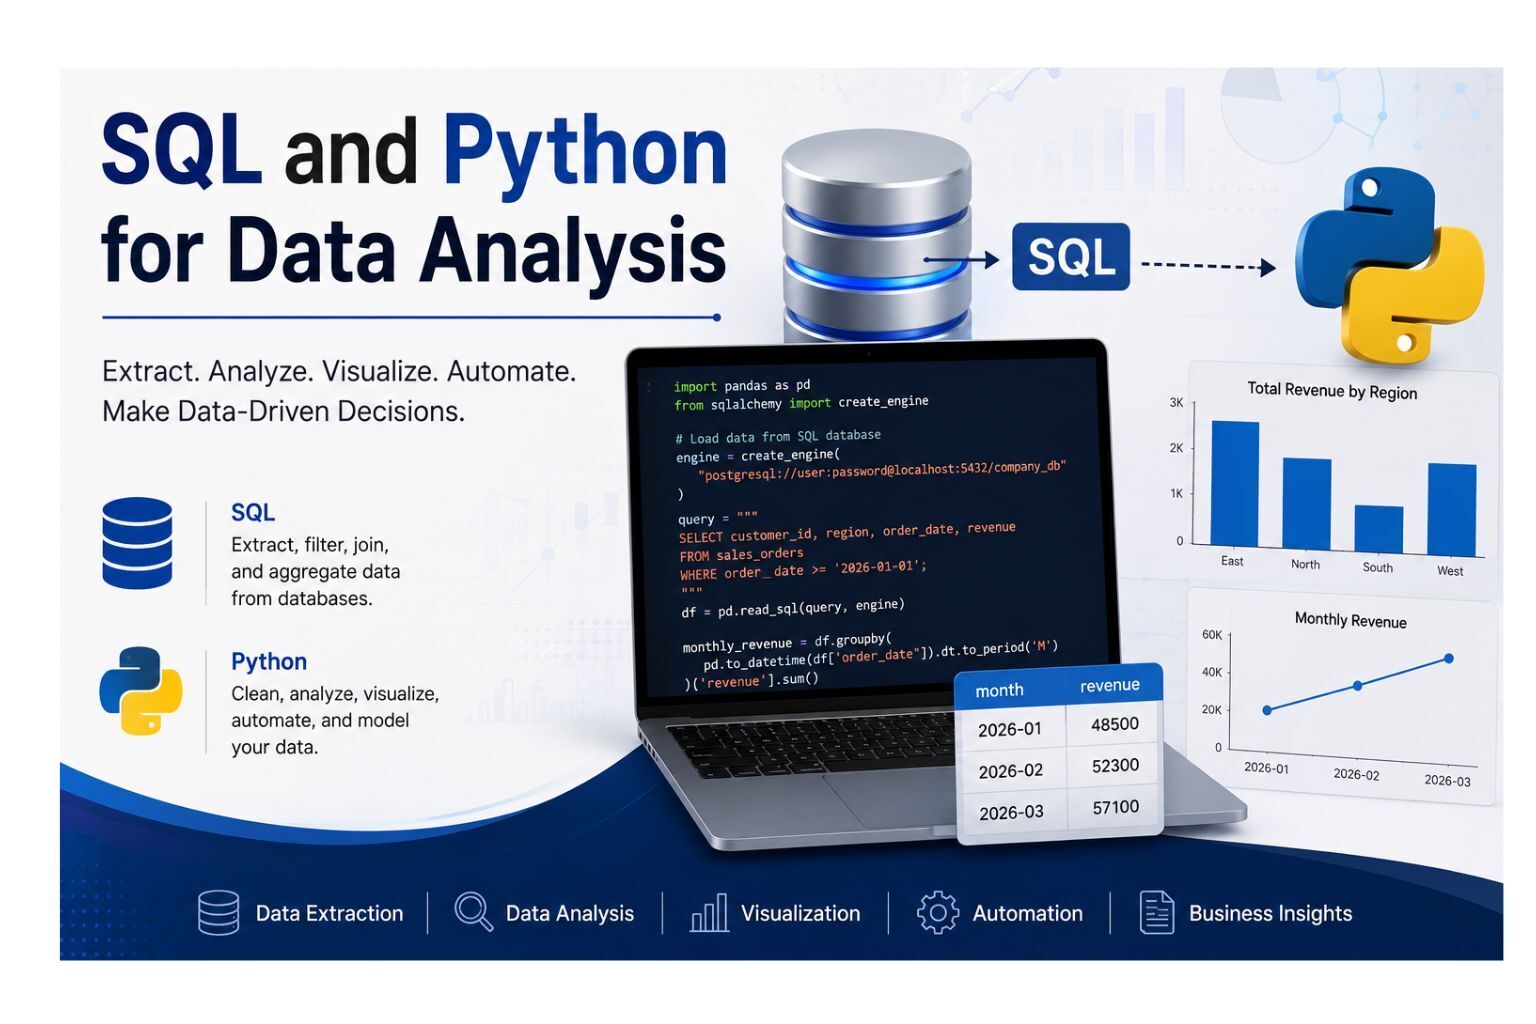
SQL and Python for Data Analysis
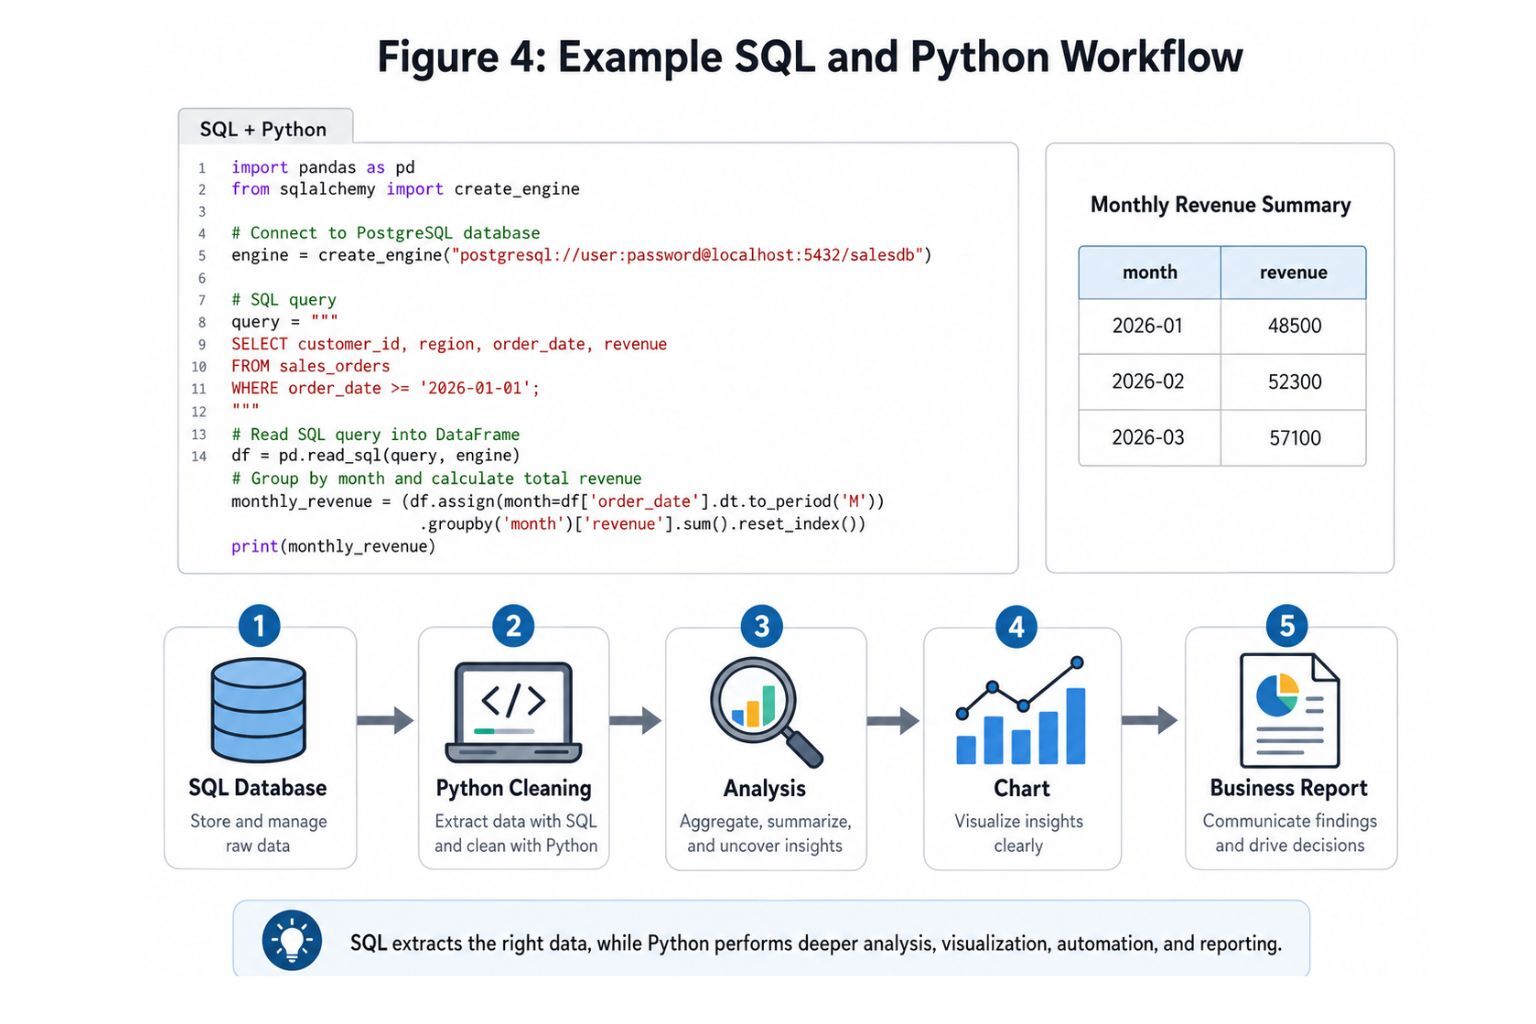
SQL and Python for data analysis work extremely well together. SQL is used to extract, filter, join, and aggregate data from databases. Python is used to clean, analyze, visualize, automate, and model that data.
A typical workflow may look like this:
Database → SQL query → Python cleaning → Python analysis → visualization → business report
For example, a company may store customer orders in a database. SQL can pull all orders from the last 12 months. Python can clean the data, calculate customer lifetime value, create charts, and prepare an executive summary.
This combination is valuable because many businesses do not keep all their data in Excel. They use databases, CRMs, payment systems, marketing platforms, and internal applications. SQL helps retrieve the data. Python helps make sense of it.
When Python Data Analysis Turns Into a Real Project
Learning Python is useful, but real projects often require more than tutorials. A tutorial dataset is usually clean, simple, and designed for practice. Real datasets are often messy, incomplete, inconsistent, and connected to business or academic decisions.
You may need professional support when:
- The dataset has missing values, duplicates, or formatting problems
- The deadline is close
- The results will be used for business decisions
- The project combines SQL, Excel, Python, and reporting
- The analysis requires statistics, forecasting, dashboards, or machine learning
- You need a clean report, not just code
- You are working on a dissertation, research project, investor report, sales report, or executive dashboard
- You are unsure which method is appropriate
For general project support, review Data Analysis Services. If your file has missing values, duplicates, formatting problems, or inconsistent columns, Data Cleaning Services may be the better starting point.
If your project involves hypothesis testing, regression, surveys, or academic research, review Statistical Analysis Services. If the goal is KPI reporting, executive summaries, or company performance tracking, Business Intelligence Services may be more relevant.
For visual reports and automated reporting systems, review Dashboard Development Services. If the project involves forecasting, churn prediction, revenue prediction, or future trend analysis, Predictive Analytics Services or Machine Learning Services may be the right next step.
Need help applying Python to a real dataset? Request a Quote and include your dataset type, deadline, analysis goals, and preferred output format.
Python Data Analysis Project Pricing
Python data analysis pricing depends on the project scope. A small task may only require cleaning one spreadsheet or creating a few summary tables. A larger project may involve SQL extraction, data cleaning, statistical testing, dashboard planning, predictive modeling, and a written report.
Pricing usually depends on:
- Dataset size
- Data quality
- Number of variables
- Cleaning complexity
- SQL or database requirements
- Statistical methods
- Machine learning requirements
- Dashboard or visualization needs
- Deadline
- Final deliverable format
Small Python data cleaning or analysis tasks may start in the low hundreds, while advanced dashboards, predictive models, or full business reports usually require a custom quote. The best way to price a project accurately is to submit your dataset details and goals through Request a Quote.
This page is not intended to replace the detailed service pages. It is a guide to help you understand Python for data analysis and decide what kind of support you may need.
What Makes a Good Python Data Analysis Project?
A good Python data analysis project starts with a clear question. The question should explain what the analysis is trying to answer and why it matters.
A strong project also needs a clean dataset. This does not mean the data must be perfect before analysis begins, but the analyst must understand the columns, missing values, duplicates, and limitations.
Good projects also use appropriate methods. Not every dataset needs machine learning. Sometimes a simple grouped summary, trend chart, or statistical test is more useful than a complex model.
The final report should include clear visuals, accurate interpretation, limitations, and recommendations. Code alone is usually not enough for business or academic decision-making. The audience needs to understand what the results mean.
Common Mistakes Beginners Make When Using Python for Data Analysis
Many beginners think Python data analysis is mostly about writing code. Code matters, but the biggest mistakes usually happen before or after the code.
One common mistake is starting without a clear question. Without a question, the analysis becomes random exploration.
Another mistake is ignoring missing values. Missing data can distort results, especially if the missing values are related to customer behavior, survey responses, or financial records.
Beginners also forget to check data types. A revenue column stored as text may not calculate correctly. A date column stored as a string may not sort properly.
Another common mistake is creating charts without interpretation. A chart should support a point. It should not be included just because it looks good.
Some beginners also confuse correlation with causation. If two variables move together, that does not automatically mean one caused the other.
Other mistakes include copying code without understanding it, overusing machine learning too early, failing to document steps, ignoring business context, and sharing sensitive data carelessly.
Python for Data Analysis Checklist
Use this checklist before starting a Python data analysis project:
- Define the objective
- Identify the main question
- Gather the data
- Confirm the file type
- Import the dataset
- Review column names
- Check data types
- Check missing values
- Remove duplicates
- Fix formatting issues
- Create calculated fields
- Run summary statistics
- Group data by key categories
- Create visualizations
- Interpret patterns
- Validate results
- Explain limitations
- Build the final report
- Save code and outputs
- Share recommendations
A checklist helps prevent mistakes and makes the analysis easier to repeat.
Frequently Asked Questions
What is Python for data analysis?
Python for data analysis means using Python to clean, organize, explore, visualize, and interpret data. It is commonly used with libraries such as pandas, NumPy, Matplotlib, Seaborn, SciPy, and scikit-learn. Python can analyze Excel files, CSV files, SQL data, survey results, business records, financial data, marketing data, and many other data sources. The goal is to turn raw data into useful insights that support decisions.
Is Python good for data analysis?
Yes, Python is one of the best tools for data analysis because it is flexible, readable, and supported by powerful libraries. It can handle data cleaning, exploratory analysis, visualization, statistics, automation, and machine learning. Python is also useful because it works with Excel, CSV, SQL databases, APIs, and business platforms. This makes it valuable for students, analysts, researchers, and companies.
How do I learn Python for data analysis?
Start with basic Python syntax, then learn Jupyter Notebook, pandas, NumPy, data cleaning, filtering, grouping, and visualization. After that, practice with real datasets such as sales data, survey responses, marketing data, or financial records. Once you understand the basics, move into SQL, statistics, dashboards, automation, and machine learning. The best way to learn is by completing practical projects.
What is the best Python for data analysis course?
The best Python for data analysis course depends on your level. Beginners should look for courses that explain Python basics, pandas, NumPy, charts, data cleaning, and projects. Intermediate learners should choose courses with SQL, APIs, statistics, and real-world datasets. A good course should include hands-on exercises, not just theory. Projects are more important than simply watching videos.
Is there a free Python for data analysis course?
Yes, there are free Python for data analysis course options online. Free courses are useful for learning the basics, practicing syntax, and understanding common libraries. However, free courses may not fully prepare you for messy real datasets, business interpretation, statistical decisions, or professional reports. If you have a real project with a deadline, a course may not be enough by itself.
Is Python for Data Analysis by Wes McKinney worth reading?
Yes, Python for Data Analysis by Wes McKinney is worth reading if you want to understand pandas, NumPy, data wrangling, cleaning, transformation, and practical workflows. It is especially useful for people who want deeper technical knowledge instead of only short tutorials. The book is often recommended because Wes McKinney is closely associated with the development of pandas.
Where can I find the Python for Data Analysis Wes McKinney book?
You can look for the Python for Data Analysis Wes McKinney book through official sources, publisher pages, authorized bookstores, libraries, and legitimate e-book platforms. If an open-access version is available from an official source, that is the safest option. Avoid unauthorized downloads because they may violate copyright or expose your device to unsafe files.
Is it safe to download a Python for Data Analysis PDF?
It depends on the source. A Python for Data Analysis PDF is safe when it comes from an official, authorized, or legitimate source. Avoid random download sites offering unauthorized PDFs. Those sites may violate copyright, provide outdated files, or include security risks. For professional and ethical learning, use official open-access sources, libraries, publisher pages, or authorized e-book platforms.
What is the difference between R and Python for data analysis?
R is excellent for statistics, academic research, and specialized statistical packages. Python is excellent for general data analysis, automation, machine learning, SQL workflows, dashboards, and software integration. If your main focus is advanced statistics or academic research, R may be attractive. If you want a broader tool for business analytics, automation, databases, and machine learning, Python is often the better choice.
Do I need SQL and Python for data analysis?
You do not always need both, but SQL and Python are a powerful combination. SQL helps extract and organize data from databases. Python helps clean, analyze, visualize, automate, and model that data. If you plan to work with business databases, customer records, sales systems, or large company datasets, learning both SQL and Python will make you much stronger.
Can Python be used for dissertation data analysis?
Yes, Python can be used for dissertation data analysis, especially for cleaning data, calculating descriptive statistics, creating charts, running regression models, and organizing survey results. However, dissertation projects often require careful methodology, correct statistical interpretation, and clear reporting. If your project involves hypotheses, research questions, or formal statistical testing, it may help to review Dissertation Data Analysis Help.
Can Python replace Excel for data analysis?
Python can replace many Excel tasks, especially when the data is large, repetitive, or requires automation. Python is better for repeatable workflows, large datasets, advanced cleaning, SQL connections, and machine learning. However, Excel is still useful for quick review, manual edits, and simple business tasks. Many analysts use both tools together.
When should I hire help for a Python data analysis project?
You should consider hiring help when your dataset is messy, your deadline is close, the results will support an important decision, or you need a clean report rather than just code. Professional support may also help when the project involves SQL, statistics, dashboards, forecasting, machine learning, or academic research requirements.
Can Data Science Consulting Pro help with my Python project?
Yes. If your Python project involves data cleaning, analysis, charts, SQL workflows, reporting, statistics, dashboards, or machine learning preparation, you can submit your project details through Request a Quote. Include the type of data you have, your deadline, your main question, and the output you need.
Conclusion
Python for Data Analysis is a practical skill for students, researchers, analysts, business owners, and professionals who want to turn raw data into useful insight. Python can help with data cleaning, exploration, visualization, SQL workflows, business reporting, academic analysis, and machine learning preparation.
The best way to learn Python is to start with the basics, practice with real datasets, and build projects that answer meaningful questions. Books, courses, and tutorials are useful, but real-world projects often require clear thinking, clean data, accurate interpretation, and strong reporting.
If you already have a dataset and need help turning it into a clean analysis, report, dashboard, or decision-ready insight, submit your details through Request a Quote.