
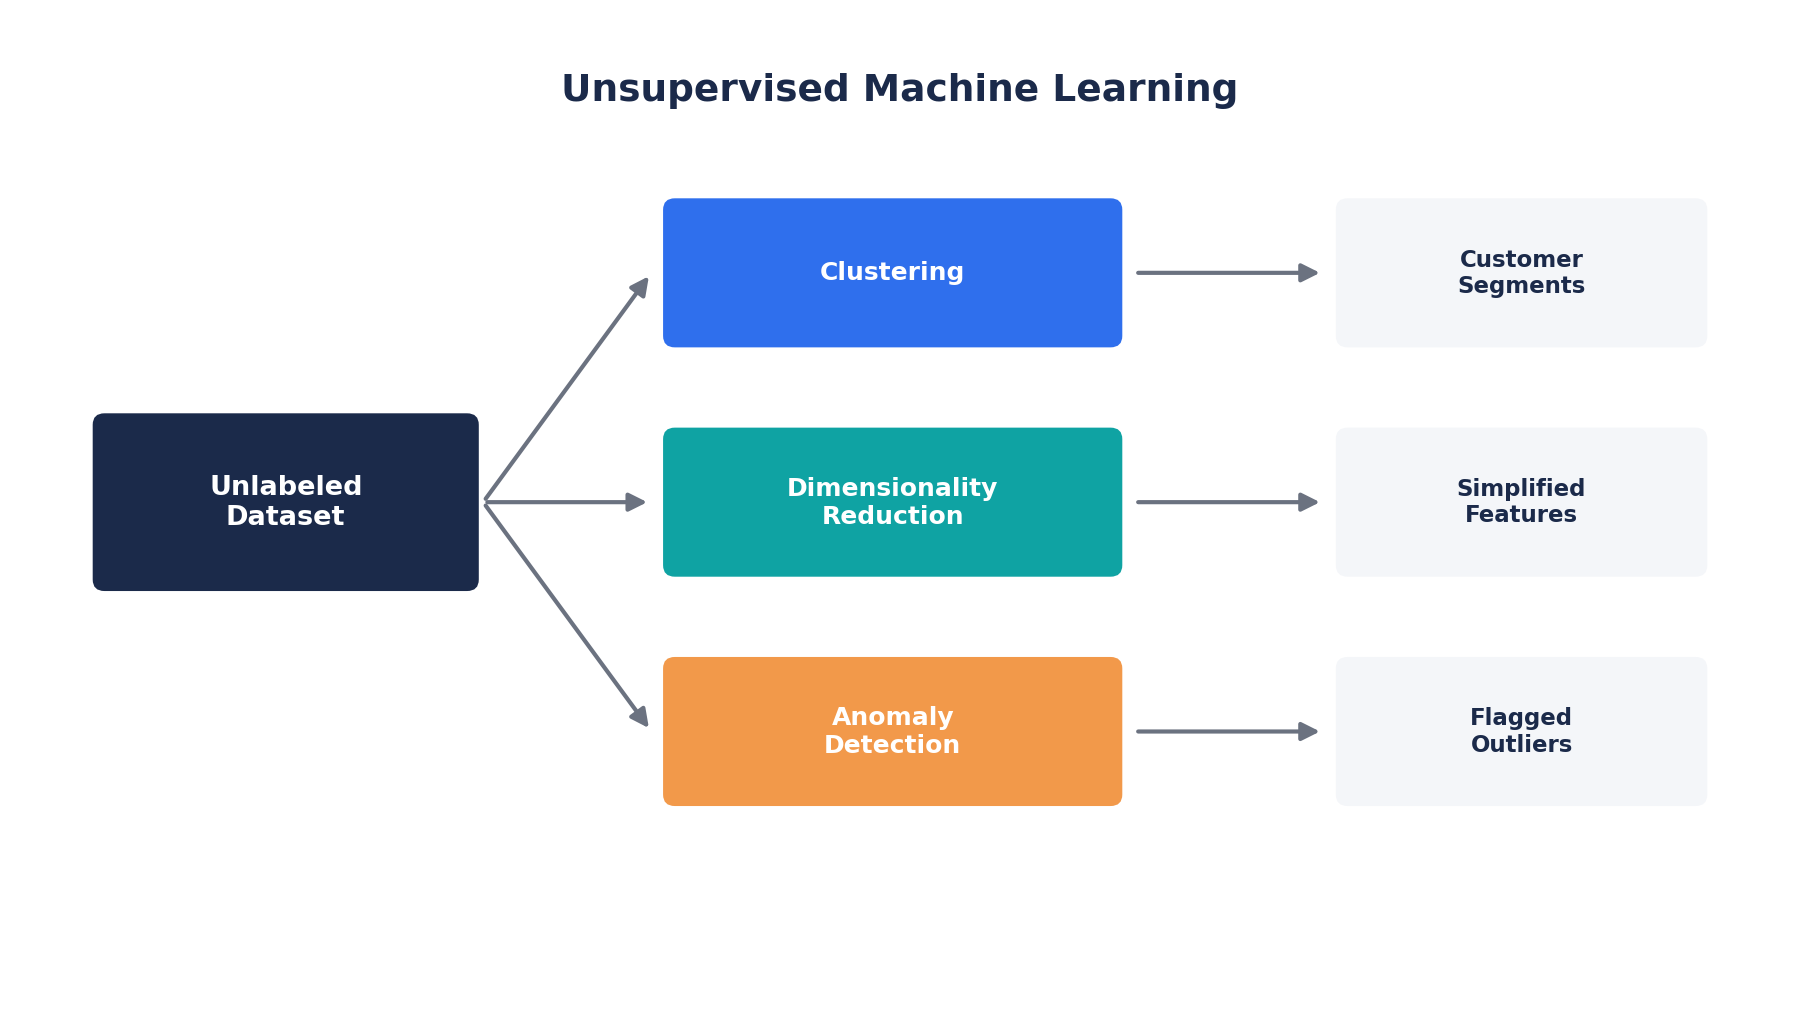
Unsupervised machine learning is a branch of machine learning that finds structure in data that has no predefined labels or target outcomes. Instead of predicting a known answer, the algorithm groups, compresses, or examines the data to surface patterns, relationships, and irregularities a human analyst might miss.
Businesses turn to unsupervised learning when labeled data is unavailable, expensive to produce, incomplete, or simply unnecessary for the question being asked. A retailer may not know how many customer segments exist, a security team may not have examples of every possible attack, and a manufacturer may not have labeled every failure mode. Unsupervised methods let these organizations start from raw, unlabeled data and still extract value.
Key Takeaways
- Unsupervised learning works primarily with unlabeled data, discovering structure rather than predicting known outcomes.
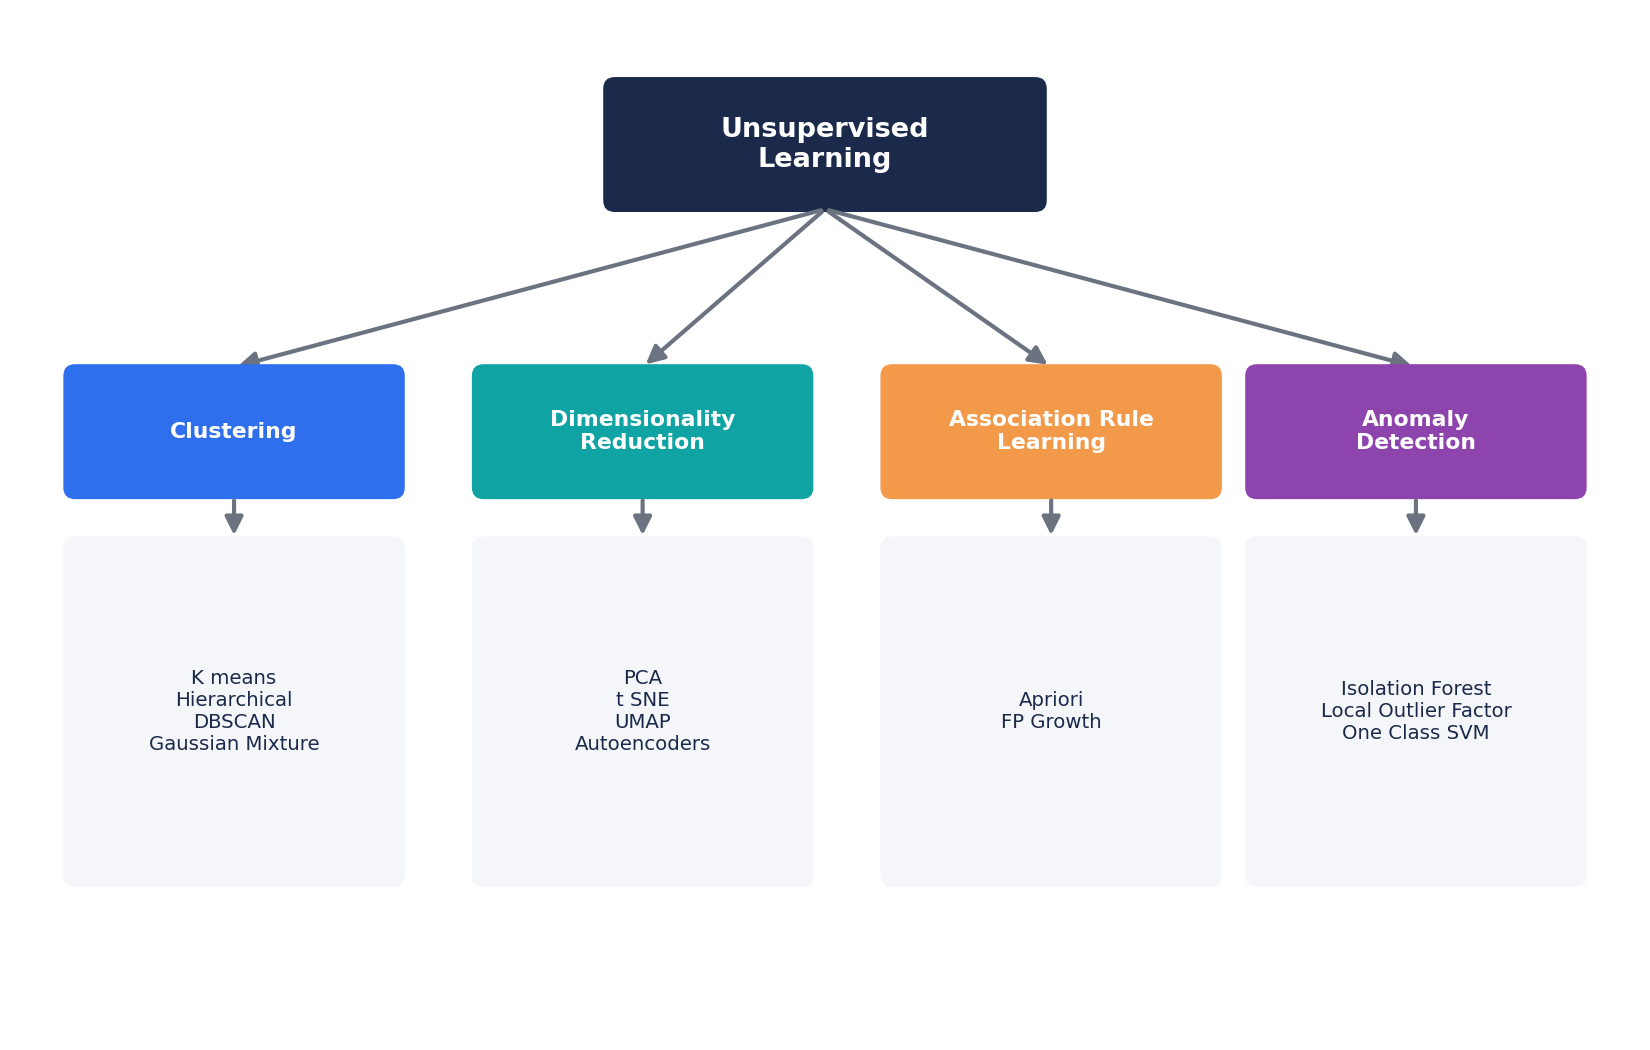
- The four major task families are clustering, dimensionality reduction, association and pattern discovery, and anomaly detection.
- K-means is the most popular clustering algorithm, but it is not the right choice for every dataset shape or business problem.
- Because there is no ground truth to check against, results require careful statistical and business validation before they are trusted.
- Common business applications include customer segmentation, fraud detection, recommendation systems, exploratory analysis, and operational monitoring.
What Is Unsupervised Machine Learning?
Unsupervised machine learning is called “unsupervised” because the training data contains no output labels to guide the model. In supervised learning, an algorithm learns from examples that already carry the correct answer. A churn model, for instance, is trained on customers already tagged as churned or retained. Unsupervised learning has no such teacher. It receives only the input features and must find internal structure on its own.
That structure can take several forms: groups of similar records through clustering, a smaller set of variables that still captures most of the information in the original data through dimensionality reduction, relationships between items that tend to occur together through association rules, or observations that do not fit the general pattern through anomaly detection.
This makes unsupervised learning especially useful for exploratory analysis, meaning situations where you do not yet know what questions to ask. Consider a retailer with years of transaction data but no predefined customer categories. A clustering algorithm can examine purchase frequency, average order value, and product categories, and surface natural groupings, such as frequent low spend shoppers versus infrequent high value buyers, that the business can then act on, without anyone having labeled a single customer in advance.
How Does Unsupervised Machine Learning Work?
A typical unsupervised learning project follows a consistent workflow:
- Define the business or analytical objective. What decision will this analysis inform?
- Collect data relevant to that objective.
- Clean and preprocess the data, handling missing values and inconsistent formats.
- Select relevant features, removing variables that add noise rather than signal.
- Scale or normalize variables where the algorithm is distance based.
- Choose an algorithm suited to the data shape and business goal.
- Fit the model to the prepared dataset.
- Identify latent structures or patterns such as clusters, components, rules, or outliers.
- Evaluate stability and usefulness using statistical metrics and repeated runs.
- Interpret results in business or domain terms.
- Deploy insights into dashboards, downstream models, or operational systems.
- Monitor performance as new data arrives and underlying patterns shift.
Preprocessing deserves special attention. Distance based algorithms such as K means calculate similarity using metrics like Euclidean distance, so a variable measured in the thousands, like annual revenue, can silently dominate a variable measured in single digits, like number of visits, unless both are scaled. Skipping this step is one of the most common reasons clustering results look wrong or arbitrary.
Types of Unsupervised Machine Learning
Clustering
Clustering groups similar observations together based on shared characteristics, without knowing the correct groups in advance. Common algorithms include:
- K means, which partitions data into a fixed number of spherical clusters
- Hierarchical clustering, which builds a tree of nested groupings
- DBSCAN, which groups points by density and explicitly flags noise
- Gaussian mixture models, which assign probabilistic, soft cluster membership
- Spectral clustering, which uses graph based similarity for irregular structures
Dimensionality Reduction
Dimensionality reduction reduces the number of variables in a dataset while preserving as much meaningful information or variation as possible. It is not simply deleting features. Key methods:
- Principal Component Analysis, or PCA, which creates new, uncorrelated variables called components that capture the maximum variance in the data
- t SNE, which projects high dimensional data into two or three dimensions for visualization, emphasizing local neighborhood structure
- UMAP, a faster, more scalable alternative to t SNE that also preserves more global structure
- Autoencoders, neural networks that learn compressed representations of the input
Association Rule Learning
Association rule learning identifies relationships between items or events that frequently occur together, most famously in market basket analysis, where customers who buy one item also tend to buy another. Core algorithms are Apriori and FP Growth, evaluated using three beginner friendly metrics:
- Support, meaning how often an itemset appears in the data
- Confidence, meaning how often the rule holds true when the condition is met
- Lift, meaning how much more likely the association is compared to random chance
Anomaly Detection
Anomaly detection identifies observations that deviate meaningfully from the general pattern in the data. Methods include Isolation Forest, Local Outlier Factor, One Class SVM, density based approaches using DBSCAN, and autoencoders, where a high reconstruction error signals an anomaly. Typical use cases span fraud detection, cybersecurity intrusion detection, manufacturing defect monitoring, and sensor based equipment health checks.
Representation Learning and Autoencoders
Autoencoders and related neural architectures learn compact, information dense representations of data without conventional class labels. These learned representations are often reused as inputs to other models, making autoencoders a bridge between unsupervised learning and downstream predictive tasks.
Unsupervised Machine Learning Algorithms Comparison
| Algorithm | Primary Purpose | Best For | Major Strength | Key Limitation |
|---|---|---|---|---|
| K Means | Clustering | Compact, spherical clusters | Fast and scalable | Must choose K in advance |
| Hierarchical Clustering | Clustering | Exploring group hierarchy | Dendrogram visualization | Expensive on large datasets |
| DBSCAN | Clustering | Irregular cluster shapes | Detects noise automatically | Sensitive to parameter choice |
| Gaussian Mixture Model | Probabilistic clustering | Overlapping groups | Soft cluster membership | Assumes underlying distributions |
| PCA | Dimensionality reduction | High dimensional numeric data | Efficient and interpretable | Primarily captures linear structure |
| t SNE | Visualization | Complex high dimensional data | Excellent local visualization | Distorts global distances |
| UMAP | Visualization and reduction | Large, nonlinear datasets | Fast and flexible | Sensitive to parameter tuning |
| Isolation Forest | Anomaly detection | Large datasets | Scalable | Requires careful tuning |
| Autoencoder | Representation and anomaly detection | Complex nonlinear data | Powerful feature learning | More complex to train |
K Means Clustering Explained
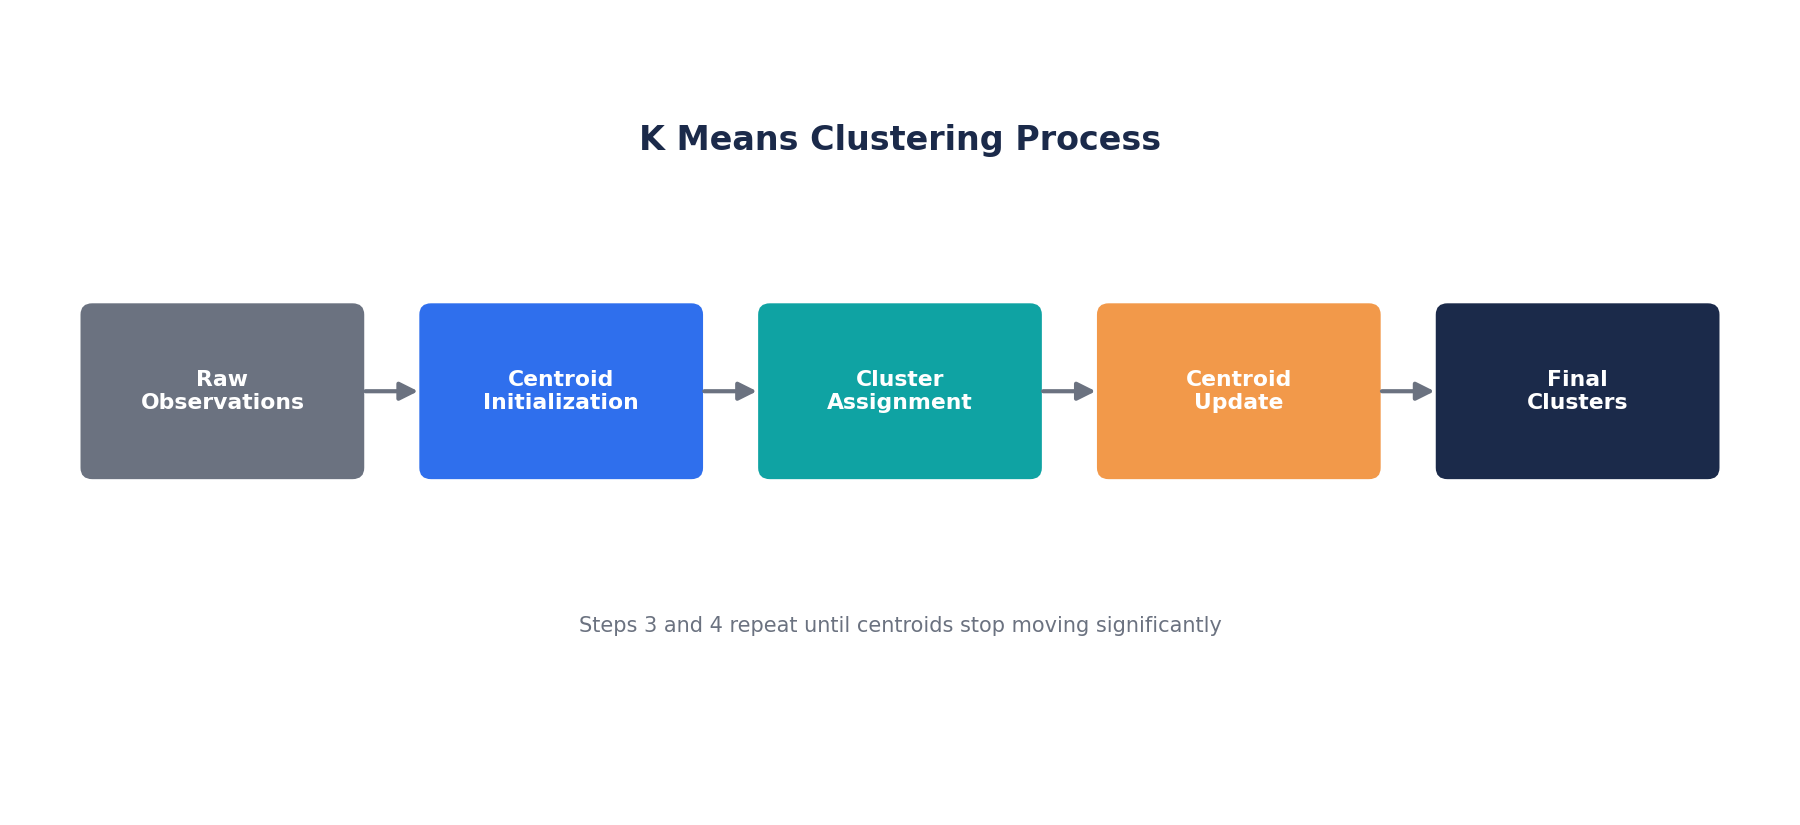
K means groups data into K clusters, where K is chosen by the analyst. The algorithm works iteratively:
- Initialize K centroids, meaning starting cluster centers, often randomly.
- Assignment step: assign every data point to its nearest centroid.
- Update step: recalculate each centroid as the mean of the points assigned to it.
- Repeat the assignment and update steps until the centroids stop moving significantly, minimizing within cluster variation.
Because K means relies on distance, feature scaling is essential. An unscaled variable can dominate the distance calculation and distort the clusters.
Choosing K:
- Elbow method, which plots within cluster variation against K and looks for the point where improvement slows
- Silhouette score, which measures how well separated clusters are
- Domain and business knowledge, since sometimes the right number of segments is dictated by what the business can act on
- Stability testing, meaning re running the algorithm on resampled data to check that clusters hold up
The elbow method is a helpful heuristic, not an infallible rule. Real datasets often produce ambiguous elbows, and the best statistical K is not always the most useful business segmentation.
Hierarchical Clustering
Hierarchical clustering builds a tree of nested groupings rather than a fixed number of clusters:
- Agglomerative clustering starts with every point as its own cluster and merges the closest pairs step by step. This is the more common approach.
- Divisive clustering starts with one cluster and splits it recursively.
Results are visualized with a dendrogram, and the number of clusters is chosen by cutting the tree at a chosen height. Linkage criteria determine how distance between clusters is measured:
- Single linkage uses the shortest distance between any two points in different clusters
- Complete linkage uses the longest distance between any two points
- Average linkage uses the mean distance across all pairs
- Ward linkage minimizes the increase in total within cluster variance
Hierarchical clustering is often preferable to K means when the number of clusters is unknown, when a nested or hierarchical business structure is expected, or when the dendrogram itself adds interpretive value.
DBSCAN
DBSCAN, short for Density Based Spatial Clustering of Applications with Noise, groups points based on density rather than distance to a centroid. Two parameters control it:
- eps, the radius used to search for neighboring points
- min samples, the minimum number of points required to form a dense region
Points are classified as:
- Core points, which have enough neighbors within eps to anchor a cluster
- Border points, which are near a core point but without enough neighbors themselves
- Noise points, which belong to no cluster
| Feature | K Means | DBSCAN |
|---|---|---|
| Cluster shape | Spherical | Arbitrary or irregular |
| Number of clusters | Must specify K | Determined automatically |
| Noise handling | None, every point is assigned | Explicitly flags noise |
| Parameter sensitivity | Sensitive to K and initialization | Sensitive to eps and min samples |
| Scalability | Very scalable | Moderate on large datasets |
Principal Component Analysis
PCA transforms correlated variables into a smaller set of uncorrelated principal components that capture the maximum possible variance in the data. Key concepts:
- Variance, the spread of the data that PCA tries to preserve
- Principal components, new axes, each orthogonal, meaning uncorrelated, to the others
- Explained variance, the percentage of total variance each component accounts for
- Loadings, how strongly each original variable contributes to a component
- Feature scaling, which is essential, since PCA is sensitive to the scale of input variables
- Choosing the number of components, typically based on a target cumulative explained variance, for example 90 to 95 percent, or a scree plot
PCA is widely used for noise reduction, visualization, speeding up downstream models, and simplifying highly correlated datasets. One caveat: principal components are linear combinations of the original variables, so they are often less intuitively interpretable than the raw features themselves.
PCA vs t SNE vs UMAP
| Factor | PCA | t SNE | UMAP |
|---|---|---|---|
| Structure captured | Linear, global variance | Local neighborhood structure | Local and some global structure |
| Interpretability | Relatively high, linear combinations | Low, axes have no direct meaning | Low, axes have no direct meaning |
| Scalability | Very good | Poor on large datasets | Good |
| Typical use | Preprocessing, noise reduction, production pipelines | Exploratory visualization | Exploratory visualization, some production use |
| Deterministic | Yes | No, stochastic | Mostly, with some randomness |
PCA remains the standard choice when you need a fast, interpretable, linear reduction suitable for production pipelines. t SNE and UMAP are best for visual exploration of complex, nonlinear structure. Neither is meant to automatically replace PCA in every workflow.
Supervised vs Unsupervised Machine Learning
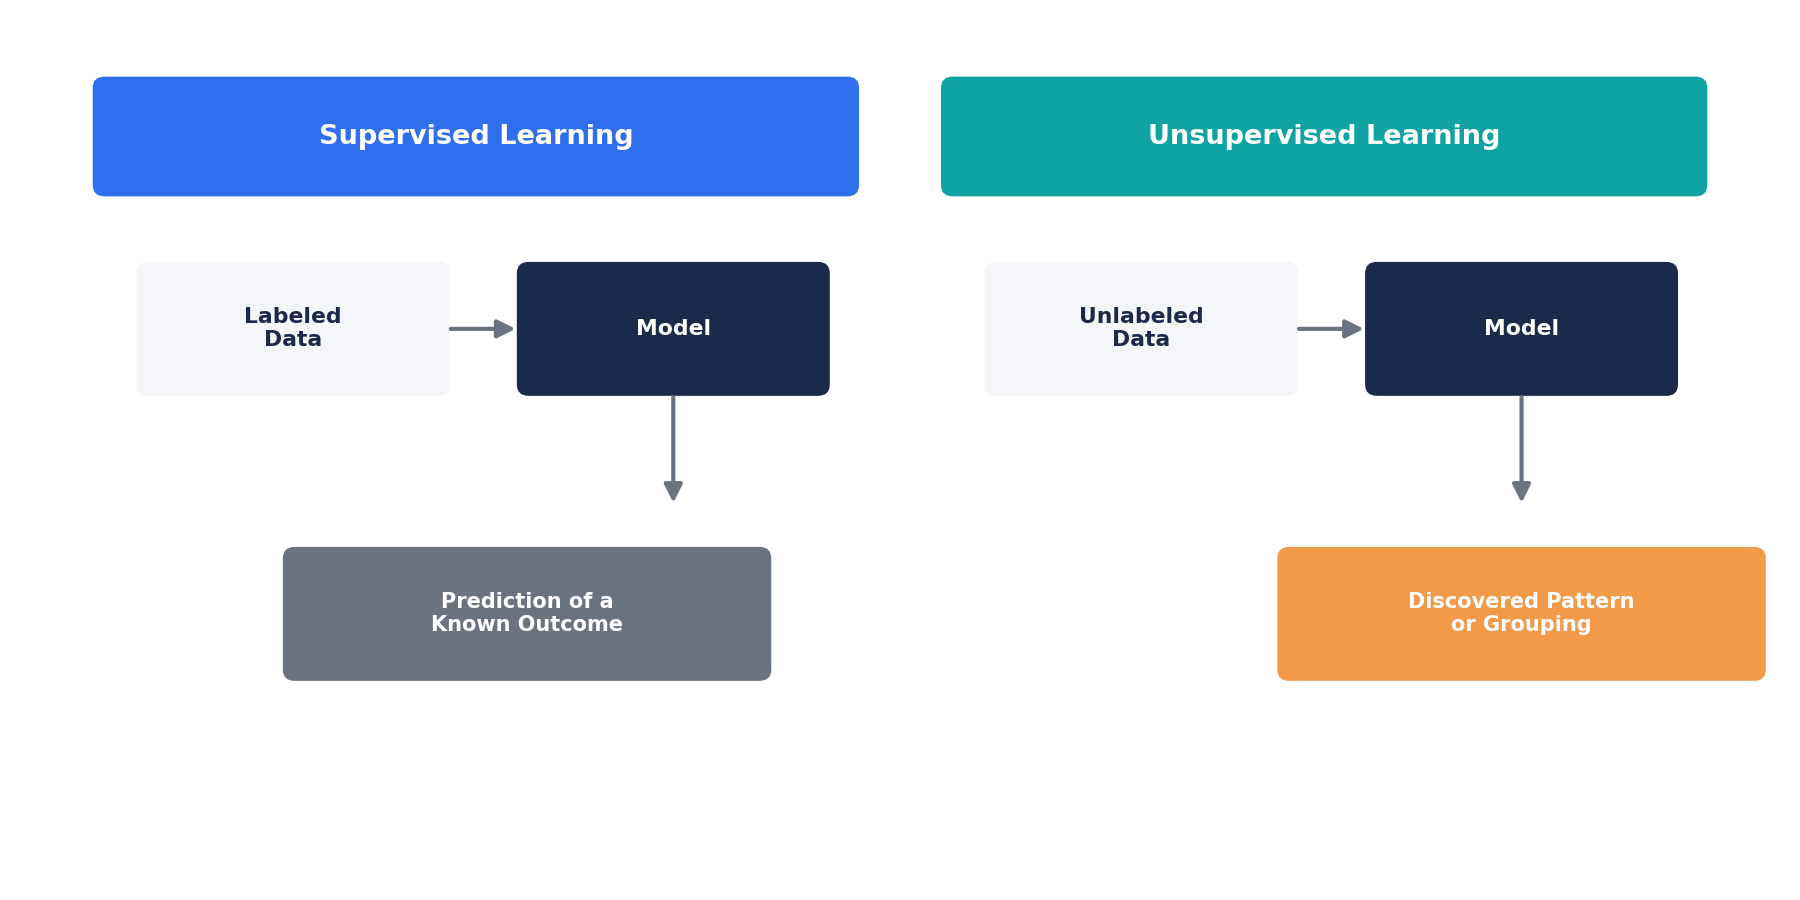
| Feature | Supervised Learning | Unsupervised Learning |
|---|---|---|
| Training data | Labeled | Usually unlabeled |
| Main goal | Predict known outcomes | Discover structure |
| Typical tasks | Classification, regression | Clustering, reduction, anomaly discovery |
| Output | Prediction | Pattern, grouping, or representation |
| Example | Customer churn prediction | Customer segmentation |
| Evaluation | Accuracy, F1, RMSE, and similar metrics | Silhouette score, stability, reconstruction error, business utility |
Two related approaches are worth distinguishing:
- Semi supervised learning combines a small amount of labeled data with a larger unlabeled dataset.
- Self supervised learning generates its own training signal from the structure of the data itself, common in modern deep learning, and is a distinct technique from traditional unsupervised learning even though both work with unlabeled data.
If your data already includes reliable outcome labels and your real goal is forecasting a known result, our predictive analytics services may be a better fit than an unsupervised approach.
Real World Unsupervised Machine Learning Examples
- Customer Segmentation: grouping customers by purchase history, demographics, engagement, or behavior to power targeted marketing and personalization.
- Fraud Detection: flagging transactions that deviate from a customer’s or population’s typical behavioral pattern.
- Cybersecurity: detecting unusual network traffic or account activity that may indicate an intrusion.
- Recommendation Systems: surfacing latent relationships between products or user behaviors to power “customers also bought” style suggestions.
- Healthcare Data Exploration: identifying potentially meaningful groupings in patient data for research purposes, while avoiding any diagnostic claims.
- Manufacturing: spotting unusual sensor readings that may indicate equipment wear or failure before it happens.
- Marketing Analytics: discovering customer personas and campaign response patterns from behavioral data.
- Finance: identifying unusual transactional patterns, accounts, or portfolio structures.
- Ecommerce: market basket analysis and behavioral segmentation to optimize merchandising and promotions.
- Natural Language Processing: topic discovery, document clustering, and semantic embeddings.
- Image Analysis: grouping visually similar images or learning compact feature representations for downstream tasks.
Business Benefits of Unsupervised Learning
- Discovering previously unknown patterns in data
- Reducing dependence on costly labeled datasets
- Improving the precision of customer and market segmentation
- Identifying anomalies before they escalate into major issues
- Supporting open ended exploratory analysis
- Simplifying complex, high dimensional datasets
- Enabling more relevant personalization
- Improving operational intelligence and monitoring
- Generating features that improve downstream predictive models
These benefits come with real trade offs, covered next.
Limitations and Challenges
- Lack of obvious ground truth, since there is no correct answer to check results against
- Difficult evaluation, as statistical metrics are useful but incomplete proxies for usefulness
- Parameter sensitivity, where small changes to K, eps, or other settings can change results substantially
- Sensitivity to feature scaling, since unscaled variables distort distance based methods
- Poor quality data, where missing values, duplicates, and noise degrade results quickly
- High dimensionality, where the curse of dimensionality can make distance metrics less meaningful
- Cluster instability, where some solutions shift dramatically with minor data changes
- Interpretability challenges, since components and clusters do not always map cleanly to business concepts
- Algorithm assumptions, for example K means assumes roughly spherical, similarly sized clusters
- Computational complexity, since some methods scale poorly to very large datasets
- Risk of finding meaningless patterns, since statistical structure is not automatically business relevant
- Need for domain expertise to judge whether output is actually useful
Finding clusters does not automatically mean the clusters have meaningful business or scientific interpretations. That judgment call requires domain knowledge and validation, not just an algorithm run.
How Do You Evaluate an Unsupervised Model?
Internal clustering metrics:
- Silhouette coefficient, which measures how similar a point is to its own cluster versus other clusters
- Davies Bouldin index, where lower values indicate better separated clusters
- Calinski Harabasz score, the ratio of between cluster to within cluster dispersion
- Within cluster sum of squares, used in the elbow method
Stability:
- Resampling the dataset and re running the algorithm
- Repeating clustering with different random initializations
- Sensitivity analysis across a range of parameter values
Dimensionality reduction:
- Explained variance ratio for PCA
- Reconstruction error for autoencoders and similar methods
- Neighborhood preservation checks where relevant
Anomaly detection:
- Expert review of flagged cases
- Validation against known historical events
- Precision and recall calculations if labeled examples eventually become available
Business validation:
Ultimately, ask whether the discovered patterns lead to a decision someone will actually act on. Model quality should never be judged solely by a single statistical metric. A mathematically clean clustering solution that no one in the business can use has limited real value.
How to Choose the Right Algorithm
| Your Goal | Consider |
|---|---|
| Segment customers into a known number of groups | K Means |
| Discover nested structure in the data | Hierarchical clustering |
| Find irregular clusters and flag noise | DBSCAN |
| Allow probabilistic cluster membership | Gaussian Mixture Models |
| Reduce correlated numerical variables | PCA |
| Visualize complex high dimensional observations | t SNE or UMAP |
| Identify unusual observations | Isolation Forest or Local Outlier Factor |
| Discover product relationships | Association rule learning |
Beyond the goal itself, weigh dataset size, dimensionality, data type (numeric, categorical, or mixed), scalability requirements, how interpretable results need to be, and above all, the business objective the analysis is meant to serve.
Practical Python Example
The example below demonstrates a complete K means workflow: loading data, scaling features, fitting the model, checking cluster quality with the silhouette score, and using PCA purely for 2D visualization. If you would rather have this built and integrated for you, our Python data analysis services can take it from prototype to production.
python
import pandas as pd
from sklearn.preprocessing import StandardScaler
from sklearn.cluster import KMeans
from sklearn.metrics import silhouette_score
from sklearn.decomposition import PCA

# 1. Load data (replace with your actual dataset)
df = pd.read_csv("customer_data.csv")

# 2. Select numeric features relevant to segmentation
features = df[["annual_spend", "purchase_frequency", "avg_order_value"]]

# 3. Scale features, essential for distance based clustering
scaler = StandardScaler()
scaled_features = scaler.fit_transform(features)

# 4. Fit K means with a chosen number of clusters
kmeans = KMeans(n_clusters=4, random_state=42, n_init=10)
cluster_labels = kmeans.fit_predict(scaled_features)

# 5. Evaluate cluster quality
score = silhouette_score(scaled_features, cluster_labels)
print(f"Silhouette score: {score:.3f}")

# 6. Reduce to 2 dimensions purely for visualization
pca = PCA(n_components=2)
components = pca.fit_transform(scaled_features)

df["cluster"] = cluster_labels
df["pca_1"] = components[:, 0]
df["pca_2"] = components[:, 1]
A second short example shows anomaly detection with Isolation Forest, useful when the goal is flagging outliers rather than grouping:
python
from sklearn.ensemble import IsolationForest

# contamination sets the expected proportion of anomalies
iso_forest = IsolationForest(contamination=0.02, random_state=42)
df["anomaly_flag"] = iso_forest.fit_predict(scaled_features)

# -1 indicates an anomaly, 1 indicates a normal observation
anomalies = df[df["anomaly_flag"] == -1]
From Unsupervised Learning to Business Decisions
An algorithm alone does not create business value. Value comes from the full pipeline connecting data to a decision:
Business problem, then dataset, then preprocessing, then model, then validation, then interpretation, then operational action, then monitoring.
For example, customer transactions feed a clustering model, which produces customer segments. Analysts profile each segment, marketing designs personalized offers around those profiles, campaign performance is measured against a baseline, and the model is periodically retrained as buying behavior shifts. Skip any step in that chain, especially interpretation and monitoring, and even a statistically excellent clustering result will fail to move the business forward.
Our dashboard and reporting solutions can turn segment profiles and monitoring metrics like these into a live view your whole team can use.
When Should You Not Use Unsupervised Learning?
- When reliable labels already exist and the actual goal is prediction, not discovery
- When the business objective has not been clearly defined yet
- When discovered clusters or patterns will not influence any real decision
- When data quality is too poor to support reliable structure discovery
- When apparent grouping is driven mainly by irrelevant or noisy variables
- When the method is chosen simply because it sounds sophisticated, not because it fits the problem
In these situations, simpler descriptive analysis or a supervised approach often answers the business question more directly and more cheaply.
Common Unsupervised Learning Mistakes
- Failing to standardize variables, letting large scale features dominate distance calculations.
- Selecting K without validation, relying on a single guess rather than the elbow method, silhouette score, or business input.
- Automatically accepting every cluster as meaningful without scrutiny.
- Treating t SNE plots as proof that true, separable clusters exist.
- Ignoring domain knowledge when interpreting results.
- Using Euclidean distance blindly on data where it is not an appropriate similarity measure.
- Ignoring outliers that can distort centroid based clustering.
- Including irrelevant features that add noise rather than signal.
- Evaluating using only one metric, missing a fuller picture of model quality.
- Failing to test cluster stability across resamples or reruns.
- Giving clusters subjective labels without evidence that they reflect real behavioral differences.
- Deploying results without monitoring as the underlying data distribution changes over time.
Need Help With an Unsupervised Machine Learning Project?
Turning unlabeled data into decisions you can act on takes more than running an algorithm. It takes the right method, careful validation, and a clear line from output to business action. Our data science consulting services and machine learning consulting team works with organizations on:
- Customer segmentation
- Clustering analysis
- PCA and dimensionality reduction
- Anomaly detection
- Fraud analytics
- Recommendation systems
- Exploratory machine learning
- Machine learning model development
- Python and R implementation
- Model validation
- Data preparation
- Dashboard and reporting integration
- Deployment support
Discuss Your Machine Learning Project. Request a Data Science Consultation. Get Help With Your Unsupervised Learning Project.
How Much Does an Unsupervised Machine Learning Project Cost?
Project cost varies based on several factors:
- Dataset size
- Data cleanliness
- Number and types of variables
- Analysis complexity
- Algorithm requirements
- Integration requirements
- Deployment needs
- Reporting and dashboard requirements
- Documentation
- Ongoing monitoring
Because every project’s scope is different, request a custom quote for your project rather than relying on generic price estimates.
Turn Hidden Patterns Into Actionable Business Insights
Unsupervised machine learning gives organizations a way to make sense of unlabeled or highly complex data, surfacing customer segments, unusual behavior, and simplified representations that would be difficult to find by hand. But the value only materializes when the work is done properly: careful data preparation, an algorithm matched to the actual problem, rigorous validation, real domain expertise, and a clear interpretation that connects back to a business decision.
If you are working with unlabeled data and want to know what it is actually telling you, DataScienceConsultingPro.com can help you turn that data into a plan you can act on.
Frequently Asked Questions
Unsupervised machine learning is a type of machine learning that analyzes unlabeled data to discover structure, such as groups, patterns, or unusual observations, without being told the correct answer in advance.
Customer segmentation is a common example. A clustering algorithm groups customers by purchasing behavior without anyone having predefined the customer categories beforehand.
The four main types are clustering, dimensionality reduction, association rule learning, and anomaly detection.
K-means is unsupervised. It groups data into clusters based on similarity without using any labeled outcome variable.
PCA is unsupervised. It reduces the number of variables in a dataset based purely on variance in the input data, with no target label involved.
Supervised learning trains on labeled data to predict known outcomes, while unsupervised learning works with unlabeled data to discover structure such as groupings or patterns.
Evaluation typically combines internal statistical metrics such as the silhouette score, stability checks across repeated runs, and business validation of whether the results are actually useful.
Key disadvantages include the lack of ground truth for evaluation, sensitivity to parameters and feature scaling, and the risk of finding statistically valid but business meaningless patterns.
There is no single best algorithm. The right choice depends on the data’s shape, size, and dimensionality, and on whether the goal is clustering, dimensionality reduction, or anomaly detection.
Yes. Algorithms such as Isolation Forest, Local Outlier Factor, One Class SVM, and autoencoders are widely used to flag observations that deviate from normal patterns.
