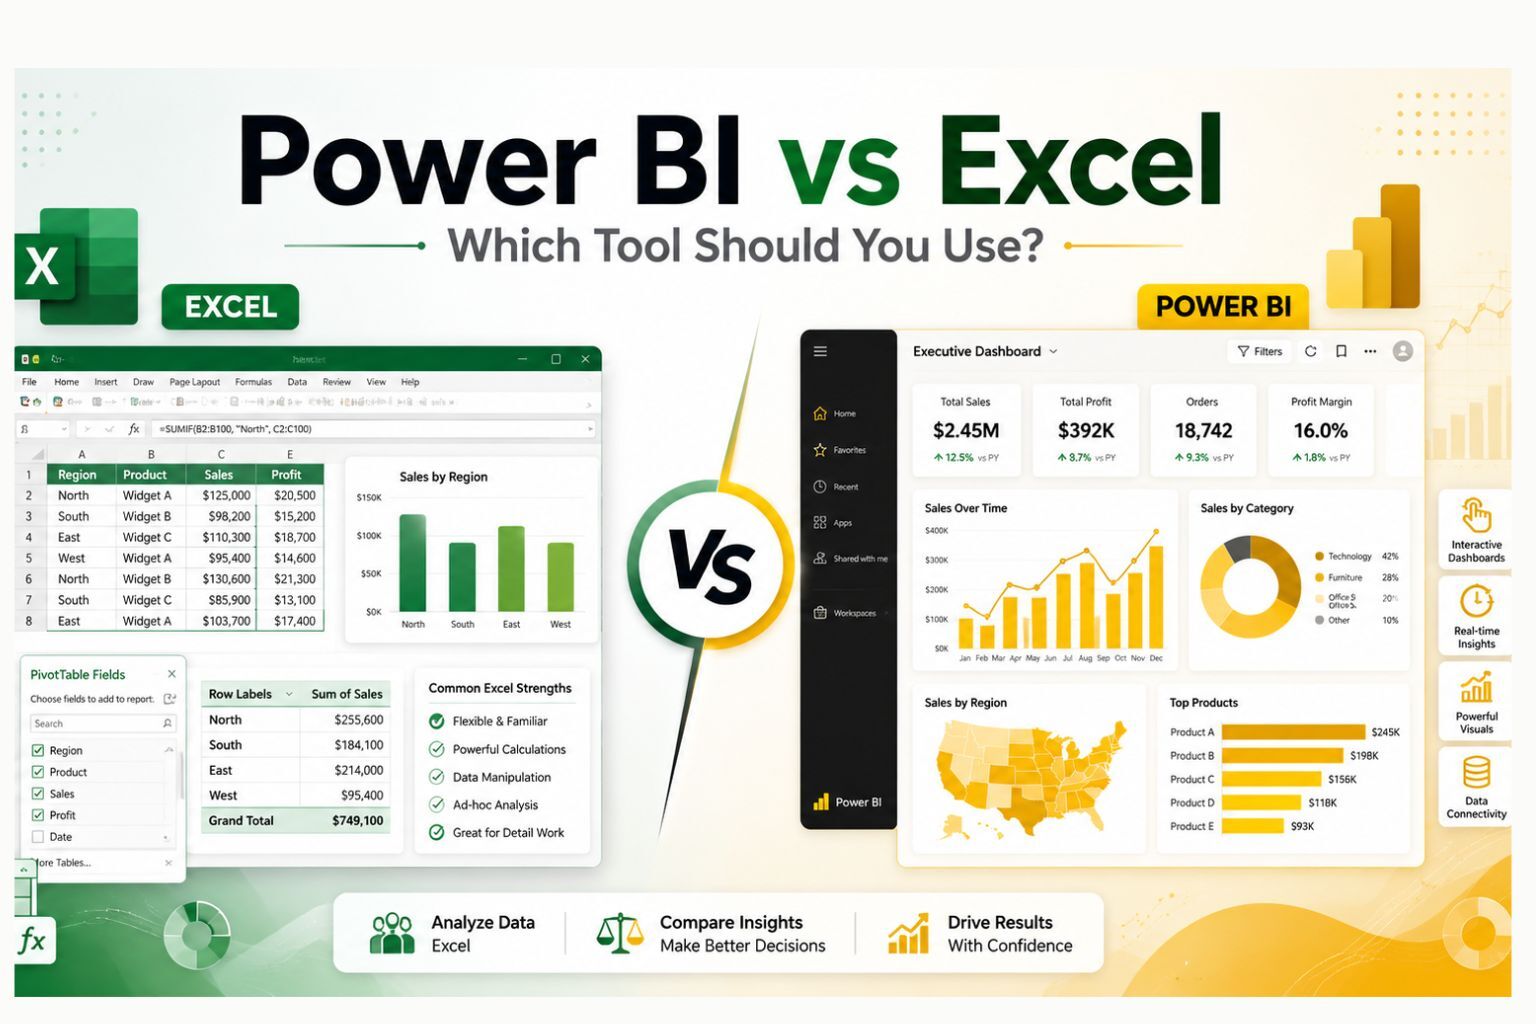
Power BI vs Excel: Which Tool Should You Use?
Power BI vs Excel is one of the most important decisions for businesses that are tired of messy spreadsheets, manual reporting, slow dashboards, and numbers that change depending on which file someone opens. Excel is still one of the best tools for quick calculations, pivot tables, budgeting, and flexible analysis. Power BI is stronger when a business needs automated dashboards, connected data, scheduled refresh, secure sharing, and one trusted version of its KPIs.
Microsoft Power BI vs Excel is not really about which tool is “better” in every situation. The real question is which tool fits your reporting workflow. A small one-time analysis may only need Excel. A monthly sales dashboard, finance report, or executive KPI dashboard may need Power BI. Many businesses get the best result by using Excel and Power BI together.
This guide compares Power BI vs Excel across dashboards, pivot tables, Power Query, reporting automation, pricing, collaboration, security, data size, business use cases, and migration. It also explains when to use Power BI vs Excel and when to bring in a data consultant to clean your reports, automate dashboards, and build a better analytics system.
For businesses that need help improving spreadsheets, dashboards, or reporting workflows, DataScienceConsultingPro.com provides data analysis, business intelligence, and dashboard consulting support.
Power BI vs Excel
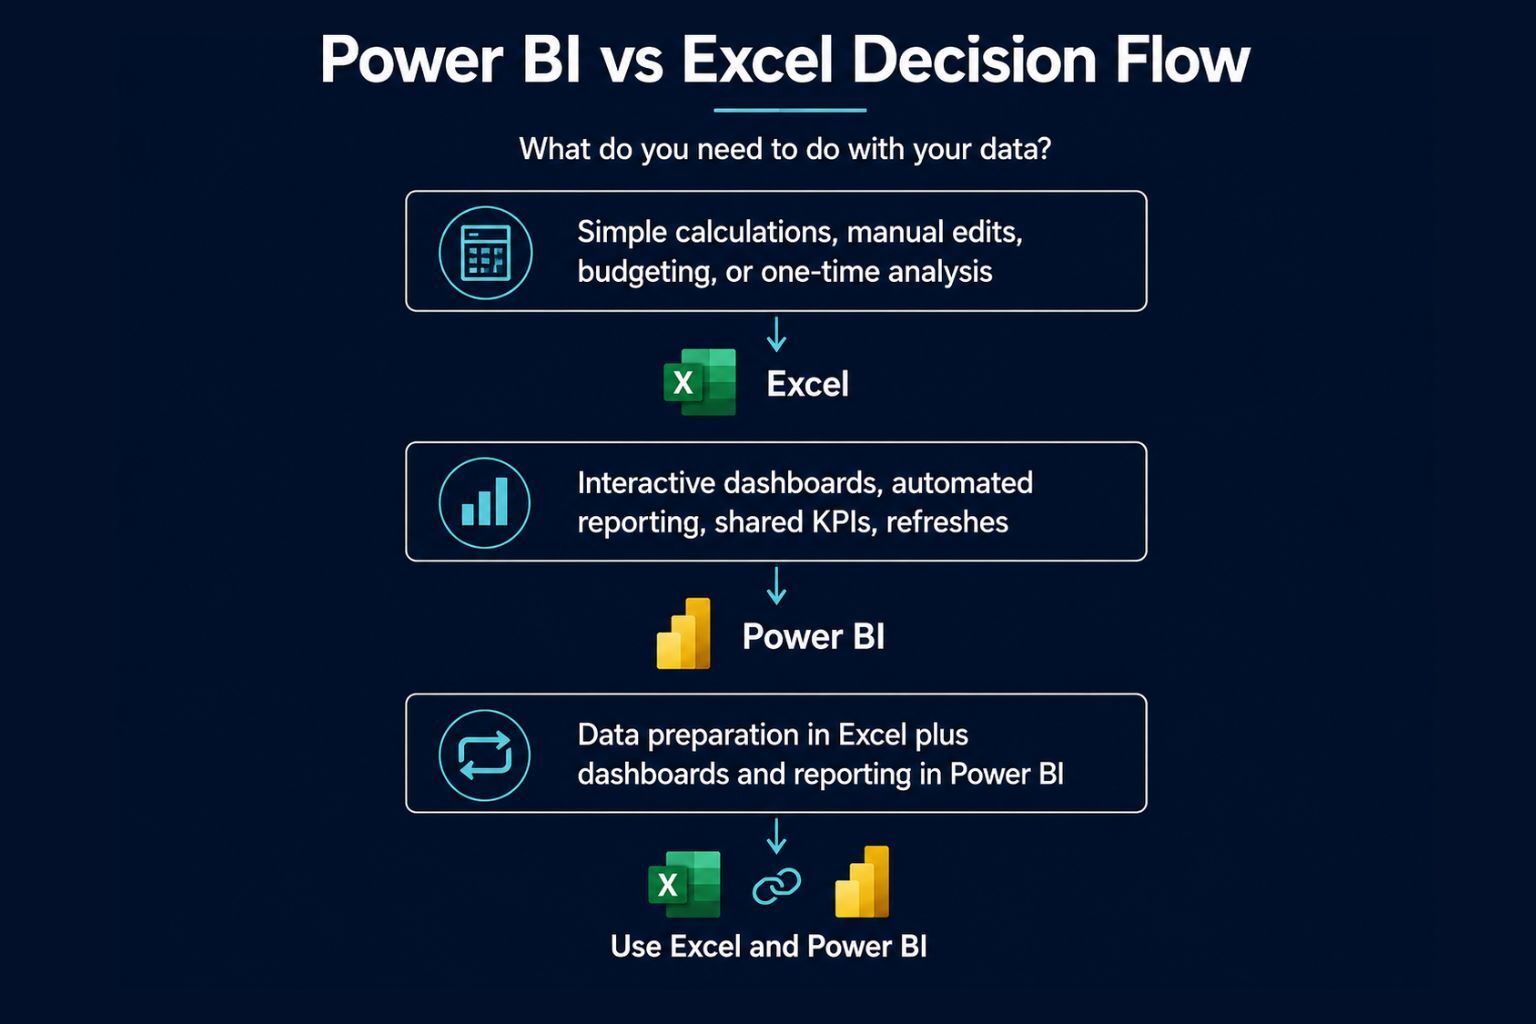
Excel is best for quick calculations, manual edits, budgeting, financial models, pivot tables, and one-time analysis. Power BI is best for interactive dashboards, automated reporting, larger datasets, shared KPIs, scheduled refresh, and business intelligence reporting.
The best choice depends on the task. If you need flexible spreadsheet work, Excel may be enough. If you need reports that refresh automatically and can be shared with decision-makers, Power BI is usually stronger. Many businesses should use both tools together because Excel supports flexible analysis while Power BI supports scalable reporting.
Best Choice by Situation
| Situation | Best Tool | Why |
|---|---|---|
| Quick calculation | Excel | Faster for simple formulas and manual edits |
| Budgeting or financial modeling | Excel | Better for assumptions, scenarios, and cell-level control |
| Pivot table analysis | Excel | Easier for quick summaries and flexible exploration |
| Executive KPI dashboard | Power BI | Better for interactive visuals and shared reporting |
| Monthly reporting automation | Power BI | Reduces manual copy-paste reporting |
| Large multi-source reporting | Power BI | Better for connected data models |
| Small one-time report | Excel | Simpler and faster to build |
| Team-wide dashboard | Power BI | Better sharing, permissions, and refresh options |
| Messy spreadsheet cleanup | Excel and Power BI | Excel can prepare data, Power BI can automate reporting |
| Growing business intelligence system | Power BI | More scalable for dashboards and reporting governance |
Table 1: Power BI vs Excel Quick Comparison
| Feature | Excel | Power BI | Best Choice |
|---|---|---|---|
| Main purpose | Spreadsheets, formulas, pivot tables, manual analysis | Dashboards, data modeling, business intelligence | Depends on the task |
| Best for | Quick analysis, budgeting, financial models | Automated dashboards and shared reports | Excel for flexibility, Power BI for reporting |
| Dashboards | Good for simple dashboards | Strong for interactive dashboards | Power BI |
| Pivot tables | Excellent and easy to use | Uses matrix visuals and data models | Excel for quick pivots, Power BI for governed reporting |
| Data cleaning | Good with formulas and Power Query | Strong with Power Query and repeatable transformations | Power BI for repeated workflows |
| Data size | Better for small to medium spreadsheet work | Better for larger connected datasets | Power BI |
| Automation | Limited unless built carefully | Strong scheduled refresh and report automation | Power BI |
| Sharing | Files, OneDrive, SharePoint, email | Workspaces, apps, dashboards, permissions | Power BI |
| Security | File permissions and workbook protection | Workspace permissions and row-level security | Power BI |
| Learning curve | Easier for most users | More advanced, especially DAX and modeling | Excel first, Power BI next |
What Is Microsoft Excel Best For?
Microsoft Excel is one of the most widely used data tools because it is flexible, familiar, and easy to start using. Many business users rely on Excel because it gives them full control over cells, formulas, charts, calculations, layouts, and assumptions.
Excel works very well when the task requires manual editing or flexible analysis. A finance manager can use Excel to build a budget. A small business owner can use it to track expenses. A student can use it to analyze survey data. A sales manager can use it to create a quick summary before a meeting.
Excel works well when users need to work directly with the data. Someone may need to change assumptions, add notes, test different scenarios, create custom calculations, or build a financial model. This makes Excel a strong choice for hands-on analysis.
Common Excel use cases include:
- Quick calculations
- Manual data entry
- Budgeting
- Forecasting
- Financial modeling
- Pivot tables
- Simple charts
- One-time analysis
- Small business trackers
- Ad hoc reporting
- Flexible spreadsheet layouts
Many professionals already know Excel, so teams can start using it quickly without learning a full dashboard system. For simple work, Excel can often solve the problem without extra tools or setup.
However, Excel becomes harder to manage when a business relies on too many spreadsheets, too many manual updates, and too many different versions of the same report. That is when Power BI may become a better option.
For companies that need help cleaning spreadsheets, analyzing datasets, or improving Excel reports, DataScienceConsultingPro.com’s data analysis services can help turn messy data into clearer business insights.
What Is Power BI Best For?
Power BI helps businesses create dashboards, automate reports, build data models, design interactive visuals, and share business insights with decision-makers.
Power BI works especially well when a report needs regular updates. Instead of downloading data, copying it into Excel, updating formulas, fixing charts, and emailing a new version every week, your business can connect Power BI to data sources and build a dashboard that refreshes on a schedule.
Power BI helps teams move from static reporting to interactive reporting. A user can click on a chart, filter by region, drill into a product category, view sales by date, or compare performance by department. This makes Power BI useful for leaders who need fast access to KPIs without asking someone to rebuild a report manually.
Power BI is best for:
- Interactive dashboards
- Executive KPI reporting
- Automated reporting
- Business intelligence
- Data modeling
- Power Query transformations
- DAX calculations
- Scheduled refresh
- Multiple data sources
- Secure report sharing
- Role-based access
- Large or repeated reporting workflows
For example, a sales team may need a dashboard that tracks revenue, pipeline, win rate, monthly trends, and performance by sales rep. A finance team may need a dashboard that tracks revenue, expenses, budget variance, and profit trends. A marketing team may need a dashboard that connects campaign data, website traffic, leads, and conversions.
In those cases, Power BI is usually stronger than Excel because the report can become a repeatable business intelligence system instead of a manual spreadsheet.
If your business wants to build dashboards, this guide on how to create a dashboard in Power BI explains the dashboard development process in more detail.
Power BI vs Excel Comparison: Main Differences
A strong Power BI vs Excel comparison should go deeper than saying Excel works for small data and Power BI works for dashboards. Both tools overlap in some areas, but each tool supports a different reporting workflow.
Excel works as a spreadsheet-first tool. It gives users direct control over cells, formulas, pivot tables, charts, and workbook layouts. Power BI works as a dashboard-first and model-first tool. It connects data, transforms it, organizes it into relationships, calculates measures, and publishes reports.
Excel is usually better when one person needs to explore data quickly. Power BI is usually better when a team needs recurring reports that are consistent, interactive, and easier to share.
Table 2: Power BI vs Excel Main Differences
| Area | Excel | Power BI | Practical Meaning |
|---|---|---|---|
| Tool type | Spreadsheet software | Business intelligence platform | Excel is flexible, Power BI is structured |
| Data entry | Strong for manual entry | Not designed mainly for data entry | Use Excel when users must type or edit data |
| Data modeling | Possible, but limited for many users | Strong with relationships and DAX | Power BI is better for reporting models |
| Dashboards | Good for simple dashboards | Strong for interactive dashboards | Power BI is better for shared dashboards |
| Automation | Can be automated, but often manual | Built for scheduled refresh | Power BI reduces repeated reporting work |
| Sharing | Files and cloud sharing | Published reports, apps, workspaces | Power BI is better for teams |
| Security | File permissions and workbook protection | Workspace permissions and row-level security | Power BI is stronger for governed reporting |
| Best users | Analysts, finance users, managers, students | Analysts, BI teams, managers, executives | Both serve different user needs |
The main Power BI vs Excel differences come down to flexibility versus scalability. Excel is flexible and fast for personal or small-team work. Power BI is stronger when reports need to be repeated, shared, refreshed, and trusted across a team or organization.
Difference Between Power BI vs Excel
The biggest difference between Power BI vs Excel is that Excel is built around spreadsheets, while Power BI is built around business intelligence reporting.
Excel gives users control over individual cells. This makes it great for manual analysis, financial models, custom formulas, and flexible reporting formats. Users can type directly into cells, change formulas, create custom layouts, and adjust calculations quickly.
Power BI focuses on data models, dashboards, measures, relationships, filters, and visuals. Instead of manually editing cells, users connect data sources, transform data, build calculations, and create dashboards that can be refreshed and shared.
Think of Excel as a flexible workspace. Think of Power BI as a reporting system.
For example, a finance manager can use Excel to test different revenue assumptions. A leadership team can use Power BI to track weekly revenue, costs, profit, and sales trends in one dashboard.
Power BI vs Excel Dashboard: Which Is Better?
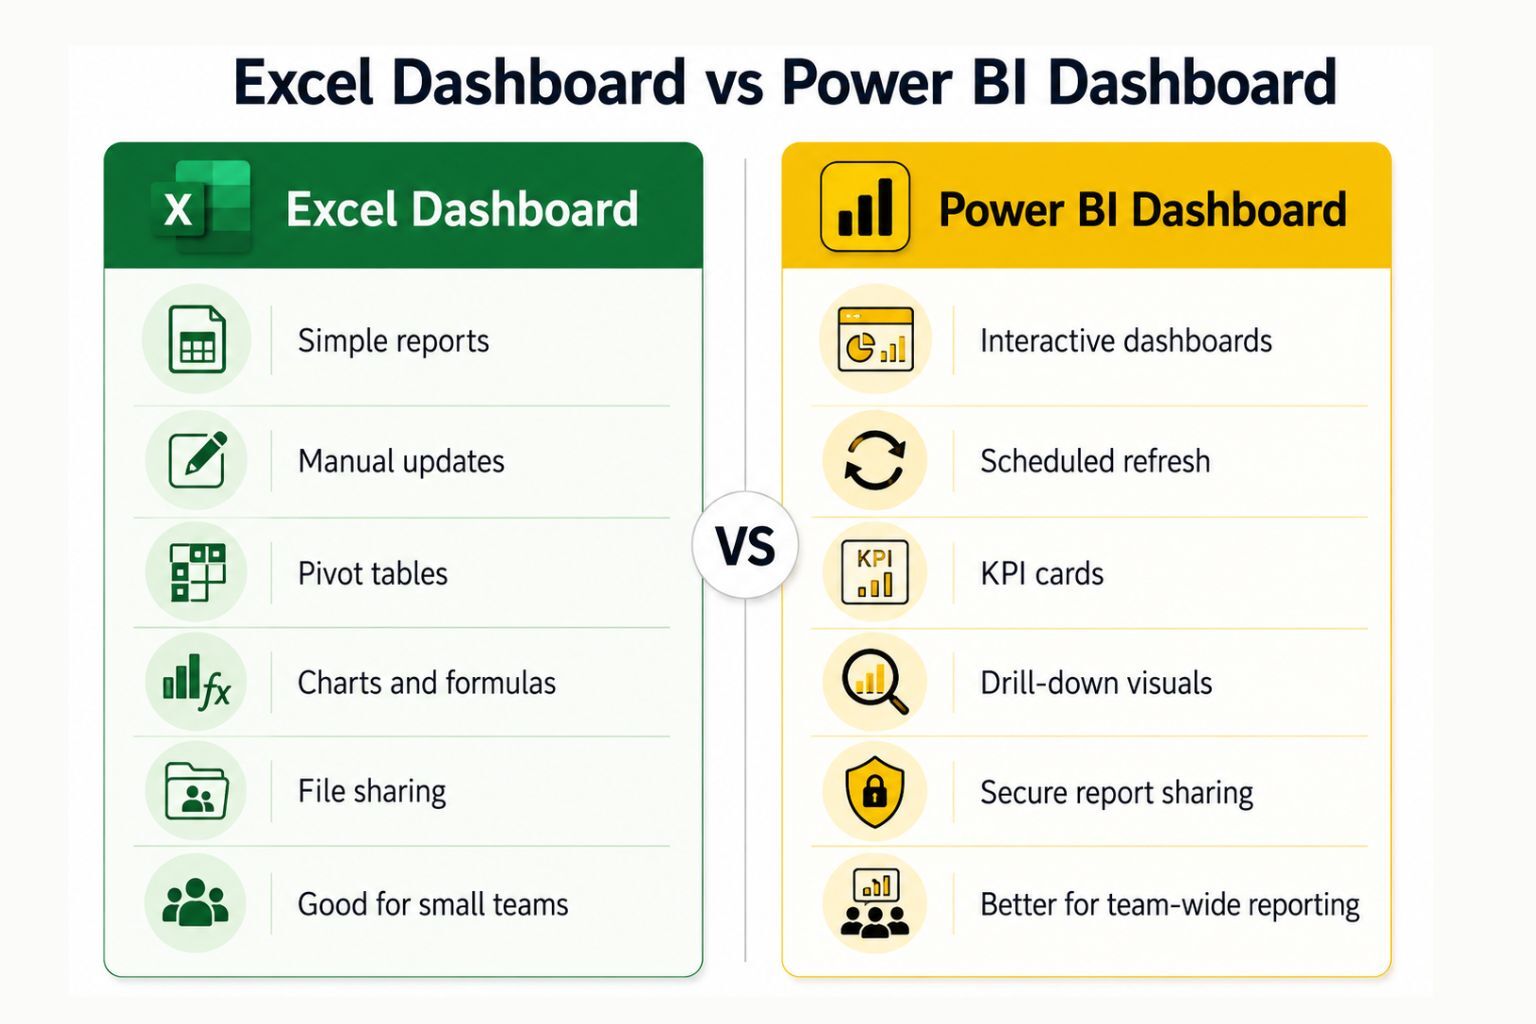
A Power BI vs Excel dashboard comparison depends on how the dashboard will be used. Excel dashboards can be very useful for simple internal reports, small datasets, manual trackers, and one-time summaries. If a manager only needs a basic sales tracker or a finance team needs a workbook with charts and pivot tables, Excel may be enough.
The limitation appears when dashboards need to be updated often, shared with several users, filtered by different departments, or connected to multiple data sources. In those cases, Excel dashboards can become difficult to maintain. One person may update the file manually, another person may save a different version, and leadership may not know which dashboard has the latest numbers.
Power BI dashboards are better for interactive reporting. Users can filter by date, region, product, customer segment, sales rep, or department without changing the underlying data. They can drill into details, view KPI cards, analyze trends, and access reports through a more controlled reporting environment.
For example, an Excel dashboard may work for a small monthly revenue summary. A Power BI dashboard is usually better for a sales leadership dashboard that tracks pipeline, closed revenue, win rate, sales rep performance, monthly trends, and regional performance in one place.
Power BI also gives businesses a better foundation for long-term reporting. Instead of rebuilding the same report every month, a company can build a dashboard once, connect it to the right data sources, and refresh it on a schedule. This makes Power BI stronger for businesses that want to reduce manual reporting and create one trusted reporting system.
Table 3: Dashboard and Reporting Comparison
| Reporting Area | Excel | Power BI | Practical Business Impact |
|---|---|---|---|
| Static monthly report | Works well | Works well | Excel may be enough for simple reports |
| Interactive dashboard | Limited compared to Power BI | Strong | Power BI gives users more ways to explore data |
| KPI cards | Possible | Strong and clean | Power BI is better for executive dashboards |
| Filters and slicers | Available | More dynamic | Power BI improves user experience |
| Drill-down analysis | Limited | Strong | Power BI helps users move from summary to detail |
| Scheduled refresh | Not always simple | Built for refresh workflows | Power BI reduces manual updates |
| Sharing dashboards | File-based sharing | Published reports and apps | Power BI is better for team-wide reporting |
| Report governance | Harder to control | Easier to manage | Power BI is stronger for business-wide reporting |
Excel Dashboard vs Power BI Dashboard
Power BI vs Excel Pivot Table: What Is the Difference?
Excel pivot tables are one of the strongest features in Excel. They allow users to summarize data quickly, group information, filter categories, and create reports without writing complex formulas. For many users, pivot tables are the easiest way to analyze data.
A pivot table can answer questions such as: total sales by region, expenses by category, revenue by month, customer count by segment, or survey responses by group. This makes Excel very useful for fast analysis.
Power BI does not use pivot tables in the exact same way. Instead, it uses matrix visuals, slicers, relationships, filters, and DAX measures. A Power BI matrix visual can look similar to a pivot table, but the reporting experience is more connected and interactive.
The Power BI vs Excel pivot table difference is simple: Excel pivot tables are excellent for quick personal summaries. Power BI is better when those summaries need to become shared dashboards, automated reports, or governed business intelligence tools.
Use Excel pivot tables when you need quick personal analysis. Use Power BI when the same analysis needs to be refreshed, shared, secured, and used by a team.
Power BI vs Excel Power Query for Data Cleaning
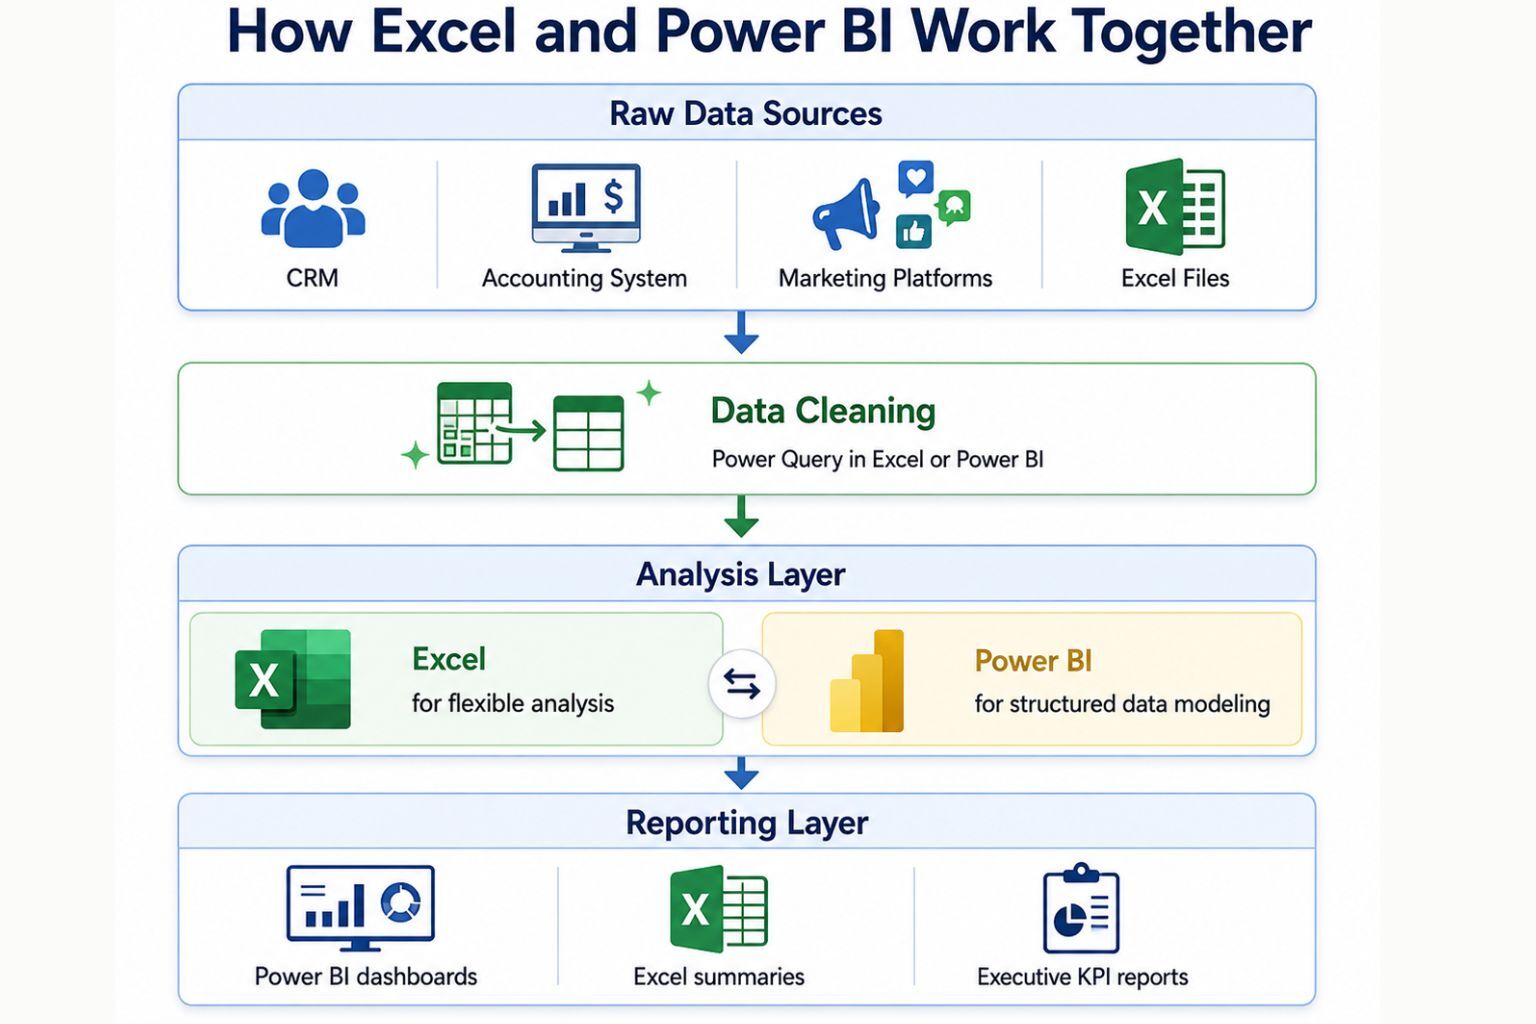
Power Query is available in both Excel and Power BI. This matters because many people do not realize that Excel and Power BI share some data preparation capabilities.
Power Query helps users clean and transform data. It can remove columns, change data types, merge tables, append files, split columns, remove duplicates, filter rows, and create repeatable transformation steps.
The Power BI vs Excel Power Query difference is mostly about where the cleaned data goes.
In Excel, Power Query is useful when you want to clean data for a workbook, pivot table, or spreadsheet report. In Power BI, Power Query is useful when the cleaned data will feed a data model, dashboard, or automated report.
For example, if you receive the same sales export every week, Power Query can clean the file in a repeatable way. If your goal is a quick workbook report, Excel may be enough. If your goal is an automated dashboard that updates for managers, Power BI is usually stronger.
This is one reason many businesses use Excel and Power BI together. Excel can still support manual review and flexible analysis, while Power BI can turn cleaned data into dashboards and repeatable reporting.
You can also explore more platforms and reporting options in this guide to data analytics tools.
Reporting Automation: Excel Reporting vs Power BI Reporting
One of the biggest reasons companies move from Excel to Power BI is reporting automation.
Excel reports often become manual over time. Someone downloads data from a system, copies it into a workbook, refreshes formulas, updates charts, checks totals, saves a new version, and emails the file to other people. This process may work at first, but it becomes risky as reporting grows.
Common Excel reporting problems include:
- Copy and paste errors
- Broken formulas
- Outdated spreadsheets
- Multiple file versions
- Manual chart updates
- Reports sent to the wrong people
- Repeated monthly cleanup work
- Hard-to-track changes
- Conflicting numbers in different files
Power BI is better for recurring reporting because it can connect to data sources, apply transformations, refresh reports, and publish dashboards in a more controlled way. This does not remove every reporting challenge, but it can reduce repetitive manual work.
For example, a monthly sales report may take 4 hours to update in Excel. If that report is rebuilt as a Power BI dashboard, the business may be able to refresh the data automatically and spend more time interpreting the results instead of preparing the report.
Power BI is especially useful when managers ask the same questions every week or month. Instead of rebuilding the report every time, the business can use a dashboard that updates with the latest data.
Data Size and Performance
Excel works well for many small and medium data tasks. However, Excel can become slow when workbooks grow too large, formulas become complex, files include many tabs, or several pivot tables depend on the same data.
Large Excel files can also create business risk. When one workbook contains many manual formulas and hidden tabs, it becomes harder to audit. A small formula error can affect important numbers. If only one person understands the workbook, the business may depend too heavily on that person.
Power BI is better for larger reporting workflows because it is designed around data models. Instead of treating every calculation as a spreadsheet cell, Power BI organizes data into tables, relationships, measures, and visuals. This makes it better suited for recurring business intelligence reporting.
That said, Power BI is not automatically fast just because it is Power BI. A poorly built Power BI report can still become slow. Good performance depends on clean data, proper modeling, efficient DAX measures, and thoughtful dashboard design.
The best choice depends on the size of the data, the complexity of the reporting, and how often the report needs to update.
Collaboration, Sharing, and Version Control
Excel can be shared through email, OneDrive, SharePoint, Teams, or other systems. For small teams, this may be enough. But as reporting becomes more important, Excel file sharing can create confusion.
Common Excel collaboration issues include:
- Too many versions of the same report
- Users editing the wrong file
- Accidental formula changes
- Unclear report ownership
- Reports saved in personal folders
- Files emailed outside the proper workflow
- Outdated numbers being used in meetings
Power BI helps solve many of these issues by publishing reports through a central reporting environment. Teams can use workspaces, apps, permissions, and dashboards to control who sees what. This makes Power BI better for companies that need shared reporting and more reliable access to business metrics.
For example, instead of emailing a spreadsheet to 12 managers, a company can publish a Power BI report and control access. Each manager can view the latest report without creating a new version of the file.
Security and Governance
Security matters when reports include financial data, customer data, employee data, sales performance, or confidential business information.
Excel can use file permissions, workbook protection, password protection, and controlled storage. However, Excel files are often copied, downloaded, emailed, and edited outside a central process. This makes governance harder.
Power BI is better for governed reporting because access can be managed through workspaces, report permissions, dataset permissions, and row-level security. This allows businesses to control who can see specific reports or specific rows of data.
For example, a national sales dashboard may show all company revenue to executives, but only regional revenue to regional managers. Power BI can support this type of controlled access better than a typical Excel workbook.
Governance also means making sure everyone uses the same definitions for metrics. If one Excel file defines profit one way and another Excel file defines it differently, leaders may lose trust in the numbers. Power BI can help centralize definitions, measures, and dashboards so the business has a clearer reporting structure.
Pricing: Is Excel or Power BI Cheaper?
Excel may look cheaper at first because many businesses already have access to it through Microsoft 365. For simple spreadsheets, quick calculations, and small reports, Excel can be the lower-cost option. If one person needs to analyze a small dataset or build a budget model, Power BI may be unnecessary.
However, the real cost is not only the software. A business should also consider the cost of manual reporting time. If an employee spends several hours every week downloading files, cleaning data, updating formulas, fixing broken charts, and emailing reports, the “cheap” Excel report may actually be expensive.
Power BI may require setup time, licensing, dashboard development, training, and maintenance. But if it replaces repeated manual reporting, reduces errors, and gives leaders faster access to KPIs, it can be more cost-effective over time.
The best pricing decision depends on the reporting workflow. A small one-time report may be cheaper in Excel. A recurring dashboard used by managers every week may be better in Power BI. A consultant can help estimate whether the cost of building a Power BI dashboard is worth the time saved from manual Excel reporting.
Table 4: Cost and Pricing Considerations
| Cost Area | Excel | Power BI | Business Note |
|---|---|---|---|
| Software access | Often included in Microsoft 365 | May require Power BI licensing depending on use | Check your current Microsoft setup |
| Development time | Lower for simple reports | Higher for structured dashboards | Power BI may require more setup |
| Manual updates | Can become expensive over time | Can reduce repeated updates | Automation can save staff time |
| Training | Many users already know Excel | Users may need Power BI training | Learning curve matters |
| Data cleanup | Often manual | Can be automated through Power Query | Both tools need clean data |
| Sharing | Simple for files, harder at scale | Stronger for teams and dashboards | Power BI is better for controlled sharing |
| Maintenance | Can become messy over time | Needs model and dashboard maintenance | Both require ownership |
| Long-term cost | Higher if reporting stays manual | Better if automation saves time | Choose based on workflow |
Need Help Choosing Between Excel and Power BI?
If your team is not sure whether to stay in Excel, move to Power BI, or use both, DataScienceConsultingPro.com can review your current reports and recommend the best setup. A consultant can identify which Excel files should stay as spreadsheets, which reports should become Power BI dashboards, and which manual reporting tasks can be automated.
This is especially helpful if your business has multiple Excel files, repeated monthly reports, unclear KPIs, slow spreadsheets, or dashboards that take too much time to update. Instead of guessing, you can get a practical reporting plan based on your data sources, users, reporting goals, and budget.
Contact DataScienceConsultingPro.com to discuss your project and request pricing for Excel reporting cleanup, Power BI dashboard development, or automated business intelligence reporting.
Advantages of Power BI vs Excel
There are several advantages of Power BI vs Excel when the goal is business intelligence reporting.
Power BI is better for interactive dashboards, scheduled refresh, shared reports, KPI tracking, multiple data sources, data modeling, centralized reporting, row-level security, executive reporting, and reducing manual reporting work.
Power BI is especially useful when a business has outgrown manual Excel reporting. If a report needs to be updated often, viewed by multiple people, filtered by department, or trusted in leadership meetings, Power BI is usually a stronger option.
Power BI can also improve consistency. Instead of several users creating different versions of the same report, Power BI allows the business to create one reporting model and publish dashboards from that model. This helps teams reduce confusion and make decisions from the same numbers.
However, Excel still has important advantages. Excel is often faster for simple analysis, easier for manual edits, better for flexible spreadsheet layouts, and more familiar to many users. It is also excellent for budgets, calculations, financial models, and quick pivot table summaries.
The best tool depends on the job. A business does not need to force every task into Power BI or keep every report in Excel. The smarter approach is to match the tool to the reporting need.
When to Use Power BI vs Excel
Knowing when to use Power BI vs Excel helps businesses avoid overcomplicating simple work or underbuilding important reporting systems.
Use Excel when the task is small, flexible, temporary, or highly manual. Excel is better when users need to type data directly, test assumptions, adjust formulas, or build a quick model. It is also better when a report does not need to be shared widely or refreshed automatically.
Use Power BI when reporting is repeated, shared, connected, or business-critical. Power BI is better when leaders need dashboards, KPIs, filters, drill-downs, and secure access to updated information.
Table 5: When to Use Each Tool
| Business Need | Use Excel When | Use Power BI When |
|---|---|---|
| Budget planning | You need manual assumptions and formulas | You need budget dashboards and variance tracking |
| Sales reporting | You need a quick sales summary | You need automated sales dashboards |
| Executive reporting | You need a one-time report | Leaders need recurring KPI dashboards |
| Data cleaning | You need a simple workbook cleanup | Cleaning must repeat across reports |
| Pivot analysis | You need fast personal summaries | The analysis must be shared and refreshed |
| Marketing reporting | You need campaign calculations | You need dashboards across channels |
| Operations tracking | You need a manual tracker | You need live operational visibility |
| Finance reporting | You need models and assumptions | You need automated finance dashboards |
| Small business reporting | You need a simple spreadsheet | You need repeatable dashboards as the business grows |
When to Use Excel and Power BI Together
Many businesses do not need to choose Excel or Power BI permanently. They need both tools in the right places.
Excel and Power BI work well together when Excel is used for flexible analysis and Power BI is used for structured reporting. A finance team may build planning models in Excel, then use Power BI for leadership dashboards. A sales team may export raw data to Excel for review, then use Power BI for monthly pipeline reporting.
Examples of using both tools together include:
- Use Excel for budgeting and Power BI for budget dashboards
- Use Excel for data entry and Power BI for reporting
- Use Excel for quick analysis and Power BI for shared KPIs
- Use Power Query in Excel for cleanup and Power BI for visualization
- Use Power BI dashboards, then export data when deeper spreadsheet analysis is needed
This approach helps teams keep Excel’s flexibility while gaining the reporting power of Power BI.
For broader support with business reporting and analytics strategy, visit DataScienceConsultingPro.com’s data analytics page.
Business Use Cases: Power BI vs Excel
Different business needs call for different tools. A small one-time report may work perfectly in Excel. A recurring dashboard used by multiple managers may need Power BI. A finance planning workflow may need both tools.
Table 6: Business Use Cases
| Use Case | Better Tool | Why |
|---|---|---|
| Monthly sales dashboard | Power BI | Easier to refresh and share with managers |
| Quick sales calculation | Excel | Faster for simple one-time analysis |
| Executive KPI dashboard | Power BI | Better for interactive and recurring leadership reporting |
| Budget model | Excel | Better for assumptions, formulas, and manual adjustments |
| Financial performance dashboard | Power BI | Better for visualizing trends and KPIs |
| Customer churn analysis | Power BI | Better for connected data and segmentation |
| Inventory tracker | Excel | Good for small manual tracking |
| Inventory performance dashboard | Power BI | Better for recurring operational reporting |
| Survey data analysis | Excel | Good for quick summaries |
| Marketing campaign dashboard | Power BI | Better for multi-source reporting |
| HR reporting | Power BI | Better for shared dashboards and security |
| Small business bookkeeping | Excel | Often enough for simple tracking |
| Revenue forecasting | Excel and Power BI | Excel for assumptions, Power BI for reporting |
How to Move from Excel to Power BI
Moving from Excel to Power BI should be planned carefully. A business should not simply rebuild every Excel file as a Power BI dashboard. Some Excel reports may still be useful. Others may be outdated, duplicated, or poorly structured.
The best approach is to review existing Excel reports, identify which ones are repeated often, clean the data, define KPIs, and then build Power BI dashboards around the most important business questions.
A good migration starts with business needs, not visuals. Before building charts, the team should ask: What decision should this dashboard support? Who will use it? Which data sources matter? Which KPIs must be trusted? How often should the report update?
It is also important to validate Power BI reports against the original Excel files. If users do not trust the numbers, they will keep using the old spreadsheets. A successful migration should include testing, documentation, and user training.
Table 7: Migration Roadmap from Excel to Power BI
| Step | What to Do | Why It Matters |
|---|---|---|
| 1 | Audit current Excel reports | Find which reports are still useful |
| 2 | Identify repeated reports | Focus on reports worth automating |
| 3 | Clean source data | Dashboards are only as good as the data |
| 4 | Define KPIs | Make sure everyone agrees on the numbers |
| 5 | Standardize calculations | Avoid conflicting formulas |
| 6 | Build a data model | Create a reliable reporting foundation |
| 7 | Create dashboard pages | Turn business questions into visuals |
| 8 | Validate numbers against Excel | Make sure the dashboard is accurate |
| 9 | Publish securely | Control who can access the report |
| 10 | Train users | Help teams actually use the dashboard |
| 11 | Maintain and improve | Keep reports accurate and useful over time |
A clean migration can save time, reduce reporting errors, and make business data easier to use.
Common Mistakes When Choosing Between Power BI and Excel
Businesses often make mistakes when deciding between Excel and Power BI. The problem is usually not the tool itself. The problem is choosing the wrong tool for the workflow.
Replacing Excel Too Early
Excel may still be the best tool for manual models, assumptions, and flexible analysis. Not every spreadsheet needs to become a Power BI dashboard.
Staying in Excel Too Long
If reports are repeated, shared widely, or updated manually every month, Power BI may be a better fit. Staying in Excel too long can lead to version control problems and reporting delays.
Building Dashboards Before Cleaning Data
A dashboard built on messy data will still produce messy insights. Data cleaning and KPI definitions should come before visual design.
Ignoring KPI Definitions
Teams must agree on how metrics are calculated before building dashboards. Otherwise, different departments may challenge the numbers.
Creating Too Many Visuals
A dashboard should answer business questions, not overwhelm users. Too many charts can make the report harder to use.
Forgetting Security
Reports with sensitive data need clear access rules. Power BI can help with permissions and row-level security, but those rules must be planned.
Failing to Validate Numbers
Power BI results should be checked against trusted sources before publishing. This builds trust with users.
Not Training Users
A dashboard only works if people know how to use it. Training helps users understand filters, slicers, drill-downs, and report pages.
Using Power BI as Only a Charting Tool
Power BI is strongest when used for data modeling, reporting workflows, and business intelligence, not just charts.
Underestimating Maintenance
Dashboards need updates when business rules, data sources, or KPIs change. A report should have an owner and maintenance plan.
Power BI vs Excel vs Tableau: Where Does Tableau Fit?
Power BI vs Excel vs Tableau is another common comparison. Tableau is a strong data visualization and business intelligence platform. It is often used for advanced visual analytics and interactive dashboards.
However, Power BI and Excel are often compared together because they are both Microsoft tools and are commonly used inside the same business environment. Many teams already use Excel, Microsoft 365, Teams, SharePoint, and other Microsoft products, which can make Power BI a natural next step.
Tableau may be a good fit for organizations that need advanced visual analytics and already use Tableau in their data stack. Power BI may be more attractive for businesses that want Microsoft integration, Excel compatibility, and business intelligence dashboards in a Microsoft-centered workflow.
This article focuses mainly on Power BI vs Excel because those tools are often used together rather than as complete replacements for each other.
How DataScienceConsultingPro.com Can Help
Choosing between Excel and Power BI can be difficult when your business already has messy spreadsheets, repeated reports, unclear KPIs, or dashboards that take too long to update.
DataScienceConsultingPro.com can help with:
- Power BI dashboard development
- Excel reporting cleanup
- Excel dashboard improvement
- KPI dashboard design
- Data cleaning
- Data analysis
- Business intelligence consulting
- Automated reporting
- Data visualization
- Power BI migration
- Dashboard maintenance
- Analytics support
If your team is still spending hours updating Excel reports manually, a Power BI dashboard may help reduce repetitive reporting work. If your Excel files are useful but messy, Excel cleanup and reporting improvement may be the better first step.
A consultant can review your current reporting process, identify which reports are worth automating, define the right KPIs, clean the data, and build dashboards that are easier to maintain.
You can explore Data Analysis Services, review common questions on the FAQs page, or contact DataScienceConsultingPro.com to discuss your project and request pricing.
FAQs About Power BI vs Excel
Power BI is better than Excel for interactive dashboards, automated reporting, shared KPIs, scheduled refresh, and business intelligence. Excel is better for quick calculations, manual edits, budgeting, pivot tables, and flexible spreadsheet work. The better tool depends on the task. Many businesses use both because Excel is strong for flexible analysis while Power BI is strong for repeatable reporting.
Power BI can replace some Excel reports, but it should not replace Excel completely in every business. Excel is still useful for manual calculations, financial models, budgeting, data entry, and ad hoc analysis. Power BI is better when reports need to refresh automatically, connect to multiple data sources, and be shared with a team.
The main difference between Power BI vs Excel is that Excel is a spreadsheet tool, while Power BI is a business intelligence tool. Excel is best for formulas, pivot tables, manual analysis, and flexible workbooks. Power BI is best for dashboards, data models, automated reporting, and shared KPI tracking.
Choose Excel when you need quick calculations, manual edits, budgets, pivot tables, or one-time analysis. Power BI is better when you need dashboards, scheduled refresh, shared reports, multiple data sources, or recurring business intelligence reporting. Both tools work well together when Excel supports flexible analysis and Power BI handles reporting automation.
Companies compare Power BI vs Excel because both tools help with data analysis and reporting, but they solve different problems. Excel is familiar and flexible, while Power BI is stronger for automation, dashboards, and shared reporting. Businesses compare them when manual spreadsheets become too slow, messy, or difficult to manage.
Power BI can be harder than Excel at first because users need to understand data models, relationships, Power Query, DAX, filters, and dashboard design. Excel is usually easier for quick calculations and basic analysis. However, Power BI becomes valuable once users need repeatable reporting and interactive dashboards.
Yes, Power BI can use Excel files as a data source. This is one reason Excel and Power BI work well together. A business can store or prepare data in Excel, then connect that file to Power BI for dashboards and reporting. However, the Excel file should be clean and structured before connecting it to Power BI.
Yes, Excel is still useful for data analysis. It is strong for quick calculations, formulas, pivot tables, charts, budgeting, forecasting, and one-time analysis. Excel is also familiar to many business users. Power BI does not eliminate the need for Excel. Instead, Power BI extends reporting capabilities when teams need automation and dashboards.
Power BI is usually better for dashboards because it supports interactive visuals, slicers, drill-downs, scheduled refresh, sharing, and governed access. Excel can still create useful dashboards, especially for simple or internal reports. However, Power BI is stronger when dashboards need to be updated regularly and shared with a team.
Power BI is better for reporting automation. Excel reports often require manual updates, copy and paste work, formula checks, and file sharing. Power BI can connect to data sources, transform data, refresh reports, and publish dashboards. This makes Power BI stronger for recurring business reports.
Excel may be cheaper for simple tasks if the business already has Microsoft 365. Power BI may require licensing, setup, training, and dashboard development. However, Power BI can be more cost-effective when it reduces manual reporting time and improves decision-making. The real comparison should include software cost, labor time, maintenance, and reporting accuracy.
Yes, small businesses can use Power BI when they need better dashboards, recurring reports, or clearer business metrics. A small business may start with Excel, then move to Power BI when reporting becomes repetitive or hard to manage. Power BI can help small businesses track sales, expenses, marketing, operations, and performance trends.
You do not need traditional coding to start using Power BI, but advanced reports may require DAX formulas, Power Query transformations, and data modeling knowledge. Basic dashboards can be created with a visual interface. More complex dashboards may need help from a Power BI consultant or data analyst.
Power BI, Excel, and Tableau are all useful, but they serve different needs. Excel is best for spreadsheets and flexible analysis. Power BI is best for Microsoft-based dashboards and business intelligence reporting. Tableau is strong for advanced visual analytics. For companies already using Microsoft tools, Power BI and Excel often work well together.
Final Verdict: Should You Use Power BI or Excel?
Use Excel for flexible spreadsheet work, manual calculations, pivot tables, budgets, financial models, one-time analysis, and smaller reporting tasks. Use Power BI for interactive dashboards, automated reporting, shared KPIs, larger datasets, scheduled refresh, and business intelligence.
The best answer is often not Power BI or Excel. The best answer is using the right tool for the right job. Excel is still valuable for quick and flexible analysis. Power BI is stronger for dashboards, automation, governance, and shared reporting.
If your team is stuck with messy Excel files, slow reports, or dashboards that take too much time to update, DataScienceConsultingPro.com can help you build a cleaner reporting system. Contact DataScienceConsultingPro.com to discuss your project and request pricing.