
A company’s executive sales dashboard opens normally at 8:00 AM. The charts load, the database is online, and the pipeline reports a successful run. Yet yesterday’s transactions are missing.
Nothing has technically failed. The infrastructure is available, the scheduled job completed, and the dashboard responds instantly. The problem is that the underlying data is stale, and this is precisely the type of failure that data observability is built to catch.
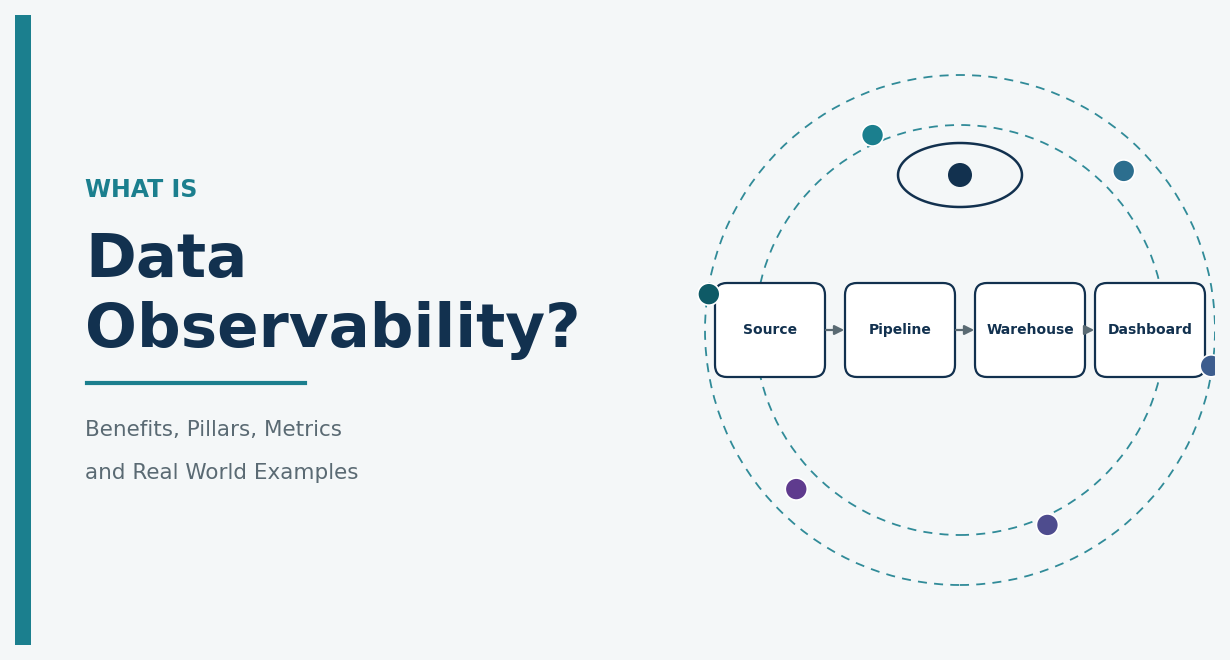
Data observability gives teams continuous visibility into the health and reliability of data as it moves from source systems through pipelines, warehouses, lakes, lakehouses, dashboards, and machine learning applications. Instead of waiting for an analyst, a finance manager, or a customer to spot a problem, teams monitor signals such as freshness, volume, schema, distribution, quality, and lineage to catch abnormal behavior early.
The goal is not simply to generate more alerts. A strong data observability practice should answer four practical questions:
- What changed?
- Where did it originate?
- What downstream assets are affected?
- What should be fixed first?
This guide explains what data observability is, how it works, the pillars and metrics that matter, how it compares to data monitoring and data quality, and how to implement it step by step.
What Is Data Observability?
Data observability is the practice of continuously understanding the health, reliability, freshness, structure, and movement of data across an organization’s systems.
It combines metadata, monitoring, data profiling, anomaly detection, lineage, alerting, and incident investigation to help teams catch unusual changes and diagnose their effects before unreliable data reaches reports, dashboards, or models.
A simple way to separate the two related terms:
Data monitoring tells you a known condition has been violated. Data observability helps you understand what happened, where it started, what it affects, and why it matters.
IBM frames observability around reliable, timely data delivery, and platform providers such as Databricks emphasize freshness, volume, distribution, schema, and lineage as the practical building blocks of the discipline.
Why Data Observability Matters
A pipeline does not need to crash to deliver bad data. A scheduled job can finish successfully while producing the wrong output. An API can silently drop a field. A transformation can introduce unexpected null values. A source table can deliver 10 percent of its normal record count. None of these trip a standard “job failed” alert.
Traditional infrastructure monitoring can confirm the server is healthy and the job finished, but it cannot confirm whether the resulting data is trustworthy.
Data observability becomes more valuable as organizations add more pipelines, sources, cloud platforms, transformations, dashboards, and machine learning applications. The larger the dependency network, the harder it becomes to diagnose failures manually.
The realistic benefit is not “perfect data.” It is catching problems earlier, narrowing the investigation, understanding downstream impact, and restoring trustworthy data faster.
How Data Observability Works
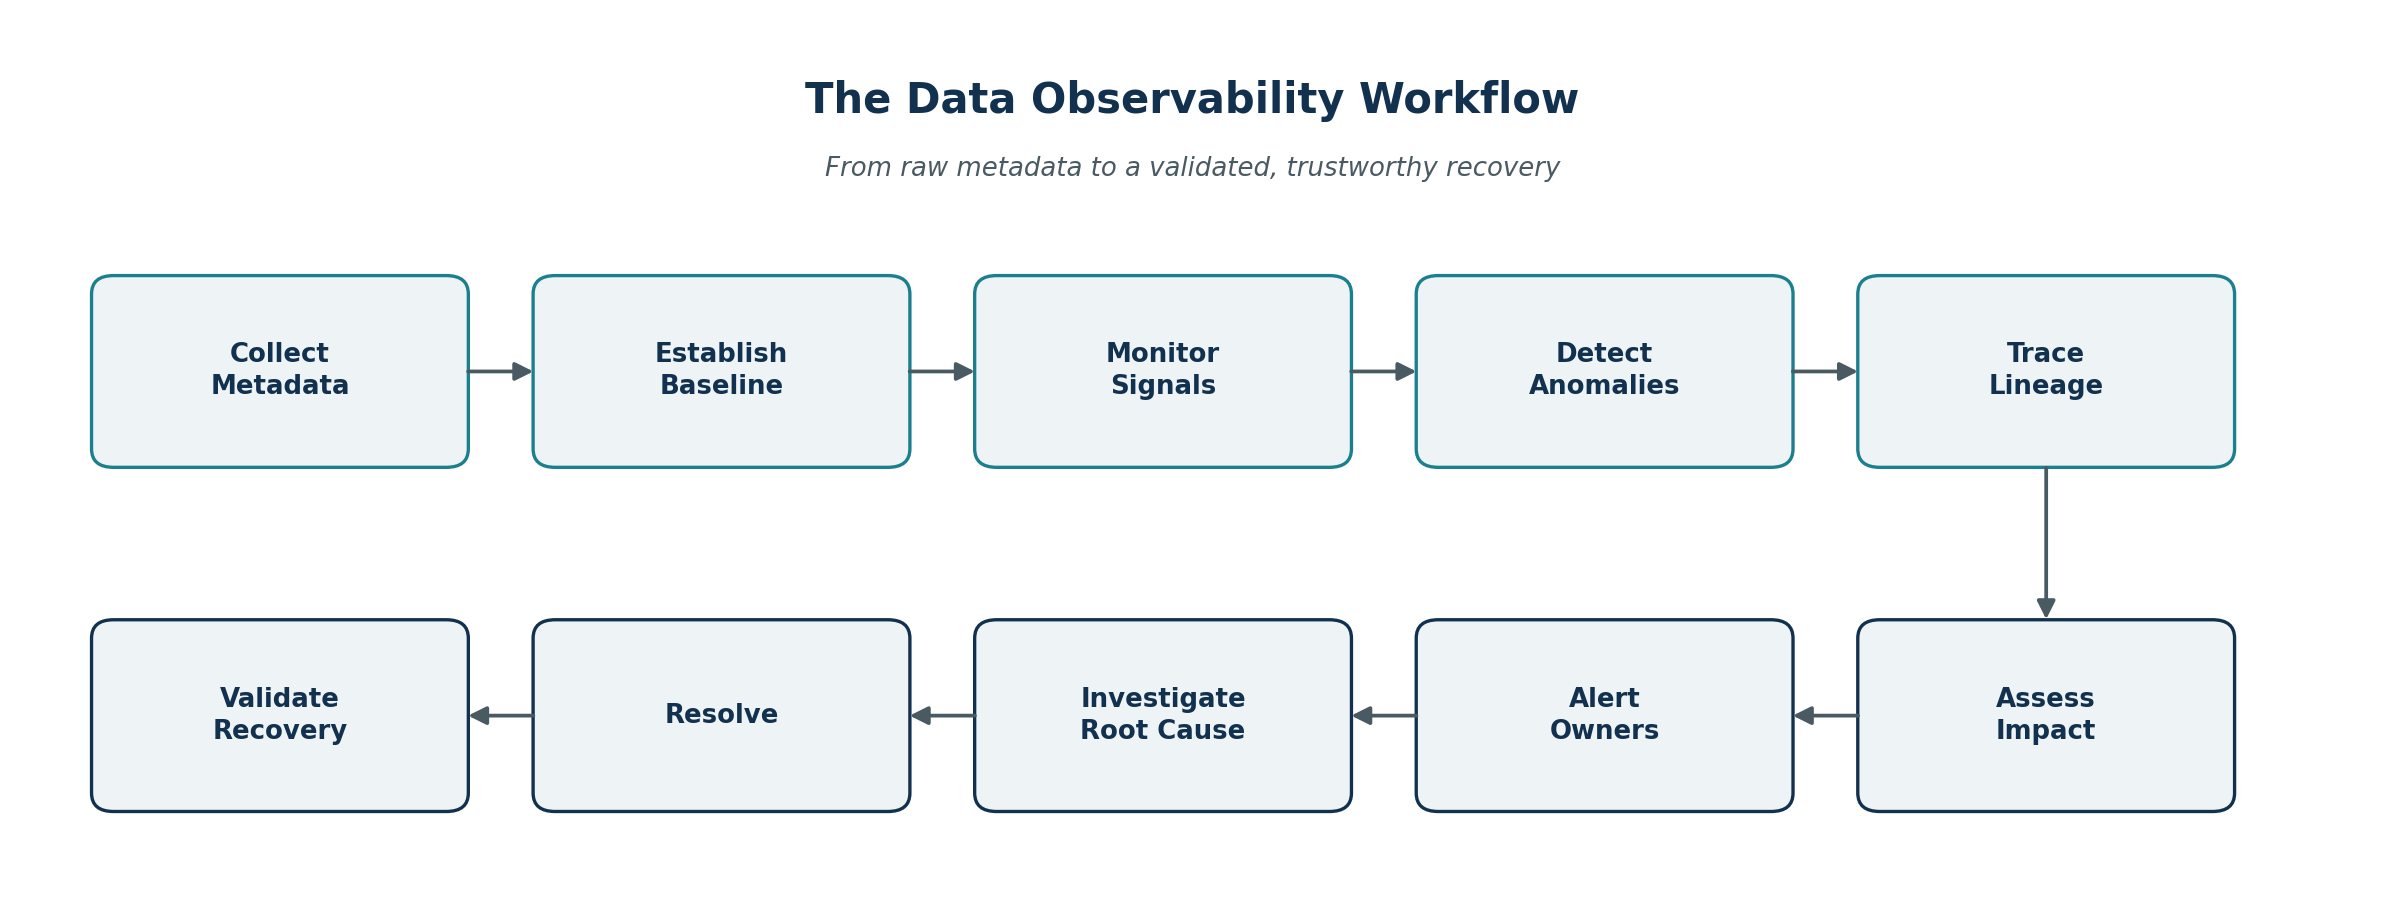
A mature workflow generally follows this sequence: collect metadata, establish normal behavior, monitor signals, detect anomalies, trace lineage, assess impact, alert owners, investigate root cause, resolve the issue, and validate recovery.
Collect metadata. This includes table and column definitions, schema history, update timestamps, row counts, query history, pipeline runs, quality test results, dependencies, and ownership records. OpenLineage, for example, defines an open standard for collecting metadata about datasets, jobs, and runs.
Establish expected behavior. Not every unusual value is a problem, so teams first need a working definition of “normal.” A transaction table might typically hold between 145,000 and 170,000 rows. A finance pipeline might typically finish by 6:30 AM. These baselines can come from business rules, historical patterns, statistical thresholds, data contracts, or explicit validation tests. Machine learning is not required. Many useful checks run on simple SQL thresholds.
Detect deviations, including missing or late data, unexpected volume changes, new null values, duplicate records, schema changes, distribution shifts, or broken dependencies.
Trace root cause and impact. If a revenue dashboard is wrong, the team needs to trace the path from the CRM, through API ingestion, into the customer table, through the sales transformation, into the revenue model, and finally to the dashboard. Data lineage lets engineers move upstream toward the likely cause and downstream toward every affected asset.
Alert the right owner. Routing should reflect business impact, factoring in dataset owner, business domain, severity, number of downstream users, financial impact, and SLA status. A missing regulatory report and a delayed test dataset should never trigger the same alert.
Verify recovery. A restarted pipeline is not a resolved incident. Teams should confirm that missing records were restored, transformations completed, quality tests passed, downstream tables updated, and dashboards now show corrected data.
The Core Pillars of Data Observability
There is no single framework every organization must follow, but most programs monitor the same six recurring signals.
| Pillar | What it tells you | Example |
|---|---|---|
| Freshness | Whether data arrived or updated on time | Daily sales table still shows yesterday’s timestamp |
| Volume | Whether the expected amount of data arrived | Order records drop from 160,000 to 18,000 |
| Schema | Whether structure changed unexpectedly | customer_id changes from integer to string |
| Distribution | Whether values behave differently than normal | Average order value jumps tenfold overnight |
| Lineage | What produced the data and what depends on it | A failed source table affects six dashboards |
| Quality | Whether records meet defined requirements | Null customer IDs exceed the approved threshold |
A closer look at each:
Freshness should reflect business cadence. A monthly regulatory dataset does not need the same threshold as a real-time fraud detection feed.
Volume drops often point to source failure, API interruption, or a broken extraction filter. Unexplained increases often mean duplicate loads or a join that multiplied records.
Schema changes are not automatically bad. The real question is whether the change is compatible with everything downstream that depends on it.
Distribution checks (minimum, maximum, mean, quantiles, null rates, and category frequencies) catch problems schema checks miss entirely. A payment column can stay technically valid while shifting from a typical $20 to $500 range to values above $50,000 because a currency conversion broke.
Lineage shows where data came from, what transformed it, and where it flows next, which matters most during incident response when one upstream change can ripple through data marts, dashboards, APIs, and machine learning features.
Quality tests determine whether data meets defined rules. Great Expectations describes an “Expectation” as a verifiable assertion about properties such as missingness, uniqueness, schema, freshness, distribution, and volume.
Data Observability vs. Data Monitoring
Monitoring and observability work together rather than replacing one another.
| Data Monitoring | Data Observability | |
|---|---|---|
| Primary objective | Detect known conditions | Understand overall data health |
| Rules | Usually predefined | Predefined plus behavioral and anomaly signals |
| Root cause analysis | Limited unless designed in | A core capability |
| Lineage | Optional | Highly valuable |
| Downstream impact | Often limited | Important |
| Unknown failure patterns | Harder to detect | Better suited |
| Incident investigation | Alert focused | Diagnosis focused |
A monitoring rule says: “Alert me if the sales pipeline fails.”
Observability asks: “The sales pipeline succeeded, so why did revenue drop 82 percent, which upstream field changed, and which dashboards are now affected?”

Data Observability vs. Data Quality
Data quality asks whether information meets defined standards such as accuracy, completeness, consistency, validity, uniqueness, and timeliness. Data observability continuously monitors how data behaves and helps teams diagnose where reliability problems actually originate.
Consider a null rate rule. A data quality check might require customer_id to be populated for at least 99.9 percent of transactions. Observability adds context: When did the null rate start increasing? Which upstream system produced these records? Was there a schema change? Which dashboards depend on this field? Who owns the affected pipeline?
Data Observability vs. Application Observability
Application observability commonly watches logs, metrics, traces, latency, errors, CPU and memory usage, and service response times.
Data observability watches tables, files, datasets, transformation outputs, freshness, schema, distribution, volume, lineage, and quality.
A database server can run with low latency while a scheduled ingestion job reports success, yet only 8 percent of expected records actually loaded. Infrastructure observability shows a healthy system. Data observability catches the abnormal volume change that the healthy system missed.
What Is Data Downtime?
Data downtime refers to periods when data is unavailable or unreliable for its intended business use. This includes data that is missing, stale, incorrect, incomplete, duplicated, or structurally incompatible.
A finance report missing transactions, a warehouse table that fails to update, or a machine learning pipeline running on outdated inputs are all examples of data downtime. IBM connects data observability directly to reducing this kind of downtime.
Common Data Observability Metrics
Metrics should reflect both technical reliability and business importance.
| Metric | What it measures | Example |
|---|---|---|
| Freshness | Time since last successful update | Customer table refreshed 9 hours ago |
| Update latency | Difference between expected and actual arrival | Daily load is 72 minutes late |
| Row count | Dataset size | Orders fall below normal range |
| Null percentage | Missing field values | product_id null rate rises to 14 percent |
| Duplicate rate | Repeated records | Duplicate orders exceed threshold |
| Schema changes | Structural modifications | Field changes from numeric to text |
| Distribution shift | Change in statistical behavior | Average transaction value triples |
| Failed quality tests | Rule violations | 4 of 30 critical checks fail |
| SLA compliance | Whether business commitments are met | Finance load completes after deadline |
| Mean time to detect | Detection speed | Incident identified 10 minutes after anomaly |
| Mean time to resolve | Recovery speed | Correct data restored in 50 minutes |
| Downstream impact | Assets affected | 7 reports depend on the broken table |
Not every dataset needs every metric. Reserve the heaviest monitoring for data that directly touches revenue, finance, customer experience, compliance, operations, or production AI systems.
Data Observability Architecture
Observability should span the full data lifecycle rather than sit only on top of dashboards. A typical flow looks like this: business systems feed ETL, ELT, or streaming pipelines, which load a warehouse, lake, or lakehouse, which feeds transformations, which power BI, analytics, and machine learning.
The observability layer collects health signals across every stage of that flow. It should confirm that records arrived from source systems, that extraction and transformation behaved normally, that storage is fresh and structurally valid, and that business transformations produced expected results for every downstream consumer.
The details shift depending on the storage layer. Warehouses need close attention to scheduled transformations, table freshness, and SQL model dependencies. Lakes need attention to file arrival, partition completeness, and schema evolution. Lakehouses need lineage tracked across raw, curated, and transformation layers, since both BI and machine learning workloads often draw from the same tables.
Worked Example: A Broken Revenue Dashboard
Consider an e-commerce business whose executive revenue dashboard refreshes every morning.
The source API previously returns a field called order_total. A vendor update silently renames that field to total_amount. Ingestion still succeeds because the records are retrieved correctly, but a downstream transformation still references the old field name. The dashboard opens on schedule, and reported revenue collapses.
A well-designed observability process would respond in this order:
- Detect an unusual spike in null revenue values.
- Identify the schema change at the source.
- Trace lineage from the API through the revenue model.
- Identify every affected dashboard and report.
- Classify the executive dashboard as a high-impact asset.
- Alert the responsible engineering team.
- Correct the transformation mapping.
- Reprocess the affected data.
- Validate the corrected dashboard output.
- Record the incident and add a check to prevent it from recurring.

Data Observability for BI, Machine Learning, and Governance
For business intelligence teams using Power BI, Tableau, Looker, or executive dashboards, observability should track source freshness, transformation completion, missing dimensions, duplicate facts, KPI distributions, and upstream schema changes. If finance is routinely messaging engineering to report that numbers “look wrong,” detection is happening too late, and business users have effectively become the monitoring system.
For machine learning systems, observability covers feature freshness, missing feature values, schema compatibility, distribution drift, and training dataset integrity. This is distinct from model monitoring, which evaluates the model’s own predictions, drift, and errors. Reliable AI needs both trustworthy data and proper model evaluation.
For governance, observability supplies evidence rather than rules. Governance might state that finance owns the daily_revenue data product and that it must be available by 7:00 AM. Observability tracks whether that expectation was actually met and provides evidence when it was not. Data contracts work the same way: a contract defines what producers and consumers agreed to, and observability detects when real world behavior breaks that agreement.
On SLAs, SLOs, and monitoring signals: an SLA is the business facing commitment, such as “finance data must be available by 7:00 AM.” An SLO is the internal target supporting that commitment, such as “99 percent of scheduled loads finish before 6:45 AM.” The monitoring signal is the raw measurement, such as the pipeline completion timestamp. Observability earns its value when the objective is missed and someone needs to know why.
Who Needs Data Observability?
Data observability pays off fastest for organizations with many shared pipelines, multiple analytical teams, production dashboards, frequent schema changes, machine learning applications, or critical regulatory and financial reporting.
Not every organization needs a large dedicated platform. A small company with five tables, one daily pipeline, one dashboard, and one technical owner can often achieve adequate reliability using SQL checks, pipeline alerts, data quality tests, clear ownership, and basic logging.
Strong warning signs that it is time to invest include users discovering problems before engineers do, recurring stale dashboards, unclear pipeline dependencies, slow root cause analysis, frequent schema changes, and growing distrust in reports.
How to Implement Data Observability, Step by Step
Step 1: Identify critical data products. Start with data connected to revenue, financial reporting, customers, operations, regulatory reporting, and production machine learning. Do not attempt to monitor everything equally.
Step 2: Assign ownership. Every critical dataset needs an accountable owner, or alerts become nobody’s responsibility.
Step 3: Map lineage. Document major upstream and downstream dependencies. A perfect lineage map is not required on day one. Start with critical assets.
Step 4: Define reliability expectations. For example: update before 06:00, maintain more than 150,000 daily rows, keep the customer ID null rate below 0.1 percent, avoid breaking schema changes, and complete the finance report by 07:00.
Step 5: Add tests and monitoring. Combine SQL validation, pipeline alerts, data quality frameworks, transformation tests, cloud native monitoring, and dedicated observability tooling where justified.
Step 6: Introduce anomaly detection. For datasets with variable behavior, statistical or automated baselines catch patterns that fixed thresholds miss.
Step 7: Classify incidents. For example: P1 for financial reporting unavailable, P2 for a stale customer operations dashboard, and P3 for a delayed development dataset.
Step 8: Route alerts. Send alerts to the people responsible for fixing or evaluating the problem, and avoid company wide alert channels.
Step 9: Establish an incident process. Follow a consistent sequence: detect, triage, diagnose, correct, reprocess, validate, and document.
Step 10: Review regularly. Remove noisy alerts, improve thresholds, document repeated causes, and expand coverage only where it creates real protection.
Data Observability Maturity Model
| Stage | Characteristics | Recommended next step |
|---|---|---|
| Reactive | Users discover most issues | Add tests and basic ownership |
| Monitored | Known failures generate alerts | Add lineage and impact context |
| Observable | Anomaly detection, lineage, and ownership are integrated | Add reliability objectives |
| Managed reliability | Critical data products have reliability targets and incident history | Optimize based on business risk |
The highest stage is not automatically necessary. The right maturity level depends on business risk, complexity, team capacity, and the importance of the data products being monitored.
Data Observability Tools and Capabilities
Evaluate capabilities before evaluating vendors. Useful capabilities include freshness monitoring, volume monitoring, schema monitoring, distribution analysis, data quality tests, metadata collection, automated lineage, impact analysis, alert routing, root cause support, incident integration, warehouse and lake integrations, orchestration support, security controls, and cost visibility.
Great Expectations focuses primarily on defining and validating explicit expectations about data, while OpenLineage provides a standard for lineage metadata. Both are examples of individual capabilities that contribute to a broader reliability stack rather than complete platforms on their own.
Build vs. Buy
| Consideration | Build internally | Buy a platform |
|---|---|---|
| Small number of pipelines | Often practical | May be unnecessary |
| Complex lineage | Requires engineering effort | Often built in |
| Initial license cost | Lower | Higher |
| Engineering effort | Higher | Usually lower |
| Deployment speed | Usually slower | Often faster |
Building internally can make sense when requirements are limited and the engineering team already maintains strong monitoring infrastructure. A dedicated platform becomes more attractive as complexity, lineage, alerting, integrations, and cross team visibility become difficult to maintain manually.
What Does Data Observability Cost?
There is no meaningful universal price, because cost depends heavily on the implementation model. Common cost drivers include platform licensing, the number of monitored assets, warehouse compute, metadata collection, monitoring query frequency, log retention, integrations, engineering time, implementation, training, and incident management.
The alternative also has a cost. Poor reliability consumes engineering hours through repeated troubleshooting, data reprocessing, dashboard investigation, and manual validation. A fair cost assessment should compare observability expenditure against the current cost of unreliable data operations.
Data Observability Best Practices and Common Mistakes
A practical program prioritizes business critical data, assigns clear ownership, combines technical and business signals, monitors freshness and volume early, maintains lineage, controls alert noise, documents expectations, and connects detection directly to an incident response process. The most important principle is selectivity: observing every table with the same intensity creates more noise than value.
The most common failures are organizational rather than technical. These include buying a tool before defining critical datasets, creating excessive alerts, treating job success as proof of healthy data, failing to assign ownership, ignoring downstream impact, running observability without lineage, and closing incidents before corrected data actually reaches users. Another frequent mistake is treating observability as a one time implementation. Data systems change constantly, so thresholds, dependencies, business priorities, and ownership need periodic review.
Measuring the Value of Data Observability
Useful measures include mean time to detect, mean time to resolve, repeat incidents, data SLA compliance, user reported data incidents, stale dataset incidents, failed critical quality checks, percentage of critical assets with owners, percentage of critical assets with lineage, and engineering time spent troubleshooting.
Avoid optimizing for the raw number of alerts. A system producing fewer meaningful alerts is often healthier than one generating thousands of notifications.
Data Observability Implementation Checklist
Before expanding observability coverage, confirm you have defined the following: critical datasets, dataset owners, pipeline owners, important downstream consumers, freshness expectations, volume expectations, schema requirements, quality rules, distribution checks, lineage, alert routing, severity levels, incident procedures, data SLAs or SLOs, documentation, and a review cadence.
Frequently Asked Questions About Data Observability
Data observability is the practice of continuously understanding the health and reliability of data across pipelines, storage systems, transformations, dashboards, and applications. It uses signals such as freshness, volume, schema, distribution, quality, metadata, and lineage to help teams detect and diagnose problems.
It helps teams find data problems before those problems spread into dashboards, financial reports, machine learning systems, or operational decisions. Observability matters most when pipelines can technically succeed while still producing stale, incomplete, duplicated, or structurally incorrect data.
Common frameworks emphasize freshness, volume, schema, distribution, and lineage, with data quality frequently monitored alongside these dimensions. The exact framework matters less than whether it gives teams enough information to understand health, dependencies, and business impact.
Monitoring typically evaluates predefined conditions such as pipeline failure or refresh delay. Observability combines those checks with metadata, lineage, anomaly detection, and broader context to explain why a problem occurred and what it affects downstream.
Data quality determines whether information meets defined standards. Data observability continuously monitors the behavior and health of the data environment and helps teams find where quality and reliability problems actually originate.
Data freshness describes how recently a dataset was updated relative to when users expect new information. A table can hold valid values while still being unsuitable for decisions if it is hours or days older than expected.
Schema drift occurs when a dataset’s structure changes over time, including columns being added or removed, names changing, or data types changing. Some schema evolution is intentional, but unplanned changes can break downstream transformations and dashboards.
Data lineage shows how information moves between sources, pipelines, transformations, storage systems, and downstream consumers. It helps teams identify upstream causes and determine which reports, tables, or models a change may affect.
No. Explicit quality tests remain important whenever an organization knows the rules that data must meet. Observability adds behavioral monitoring, metadata, lineage, anomaly detection, and incident context around those checks.
No. Small environments may achieve sufficient reliability with pipeline alerts, SQL tests, logs, data quality rules, and clear ownership. Dedicated platforms become more attractive as systems, dependencies, users, and business risk grow.
Useful metrics include freshness, loading latency, row count, null rate, duplicate rate, schema changes, distribution changes, failed quality tests, SLA compliance, mean time to detect, mean time to resolve, and the number of downstream assets affected.
It monitors the freshness, completeness, schema, and distribution of training and inference data, helping teams catch upstream data problems before they compromise model inputs. Model performance itself still requires separate monitoring.
Conclusion: Building Trust Through Data Observability
Data observability is ultimately about understanding whether the information flowing through your business can be trusted. A successful pipeline run does not guarantee correct data. A responsive dashboard does not guarantee fresh data. A healthy database server does not guarantee that every required record arrived.
Observability closes this gap by combining freshness, volume, schema, distribution, quality, and lineage with clear ownership and a working incident response process. It should complement rather than replace data quality testing, infrastructure monitoring, governance, and good engineering practice.
The strongest implementation does not begin with the most sophisticated platform on the market. It begins by identifying the datasets that matter most to the business and defining what reliable behavior actually looks like for each one.
