
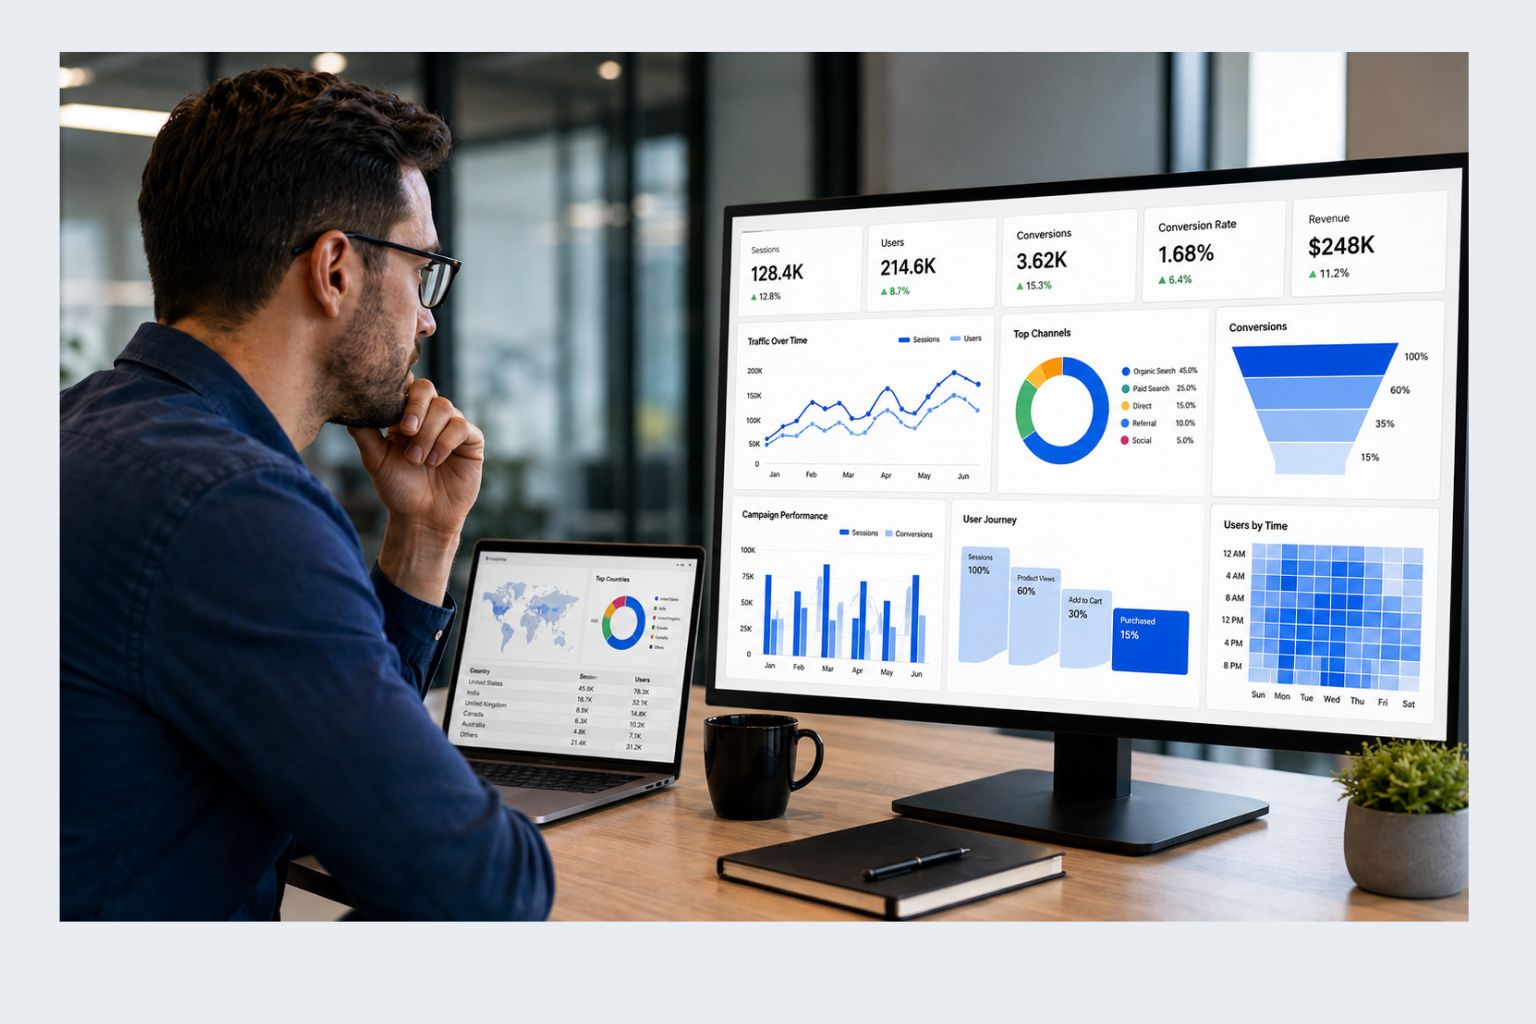
Understanding what happens on your website, app, campaign, or online store requires more than collecting reports. Businesses generate enormous amounts of digital data every day, but raw numbers alone do not explain why users convert, where customers abandon the journey, or which marketing activities contribute to business growth.
Digital analytics services help organizations transform digital data into actionable insights. By analyzing user behavior, traffic sources, conversions, customer journeys, and engagement patterns, businesses can make more informed decisions and improve marketing, product, and operational performance.
At DataScienceConsultingPro.com, we provide digital analytics services that help organizations evaluate tracking accuracy, analyze customer interactions, understand performance trends, and build reliable reporting systems. Whether you operate an e-commerce store, SaaS platform, healthcare organization, educational institution, or lead generation website, digital analytics helps convert data into meaningful business intelligence.
Our consulting approach focuses not only on collecting data but also on ensuring that the information being used is accurate, interpretable, and aligned with business goals. From Google Analytics 4 reviews and conversion measurement to funnel analysis and dashboard reporting, digital analytics supports better decision-making across the entire customer lifecycle.
What Are Digital Analytics Services?
Digital analytics services involve the collection, validation, analysis, interpretation, and reporting of digital data generated by websites, applications, campaigns, products, and online platforms. These services help businesses understand how users interact with digital assets and identify opportunities for improving performance.
Unlike basic reporting, digital analytics goes beyond counting visitors and page views. It focuses on understanding user behavior, customer journeys, engagement patterns, conversion processes, and business outcomes.
Digital analytics services may include:
- Website traffic analysis.
- Conversion analysis.
- Funnel performance evaluation.
- Campaign reporting.
- Marketing attribution.
- E-commerce analytics.
- Product analytics.
- Customer journey analysis.
- Dashboard development.
- KPI reporting.
- Event tracking reviews.
- Analytics audits.
The purpose of digital analytics is not simply to collect more data. Instead, it is to provide insights that support better decisions and improve digital performance.
Common Questions Digital Analytics Helps Answer
| Business Question | Analysis Performed |
|---|---|
| Where does website traffic come from? | Traffic source analysis |
| Which campaigns generate conversions? | Campaign performance analysis |
| Where do users abandon the funnel? | Funnel analysis |
| Which products drive revenue? | E-commerce analytics |
| Why are conversions declining? | Conversion performance analysis |
| What should executives monitor? | KPI reporting |
| Which channels perform best? | Attribution analysis |
Businesses that understand these answers are generally better positioned to optimize marketing investments, improve user experiences, and increase conversion performance.
Why Digital Analytics Matters
Modern businesses rely heavily on digital channels to generate leads, acquire customers, and deliver products and services. However, making decisions without reliable measurement often results in wasted budgets and missed opportunities.
Digital analytics helps organizations move beyond assumptions by providing evidence-based insights into customer behavior and performance.
Better Decision-Making
Reliable analytics enables businesses to understand what is happening across their websites and campaigns. Instead of relying on intuition, organizations can use data to prioritize actions and allocate resources more effectively.
Improved Conversion Performance
Understanding where visitors abandon the customer journey helps businesses optimize forms, landing pages, checkout processes, and calls to action.
More Effective Marketing
Campaign analytics reveals which channels contribute to business outcomes and which channels may require adjustments. This supports more efficient allocation of advertising budgets.
Increased Visibility Into Customer Behavior
User behavior analysis helps organizations understand how customers interact with websites, applications, and products. These insights can reveal friction points and opportunities for improvement.
Stronger Reporting
Executives and stakeholders need meaningful metrics rather than overwhelming reports. Digital analytics helps organizations focus on KPIs that align with business objectives.
Benefits of Digital Analytics
| Benefit | Business Impact |
|---|---|
| Better decisions | More informed strategy |
| Conversion optimization | Increased leads and sales |
| Customer insights | Improved experiences |
| Performance visibility | Stronger reporting |
| Budget efficiency | Better marketing ROI |
| Data quality | More reliable decisions |
| KPI tracking | Improved accountability |
Organizations that invest in digital analytics are generally better equipped to identify opportunities, measure performance, and support long-term growth.
Types of Digital Analytics Services
Digital analytics covers a broad range of activities depending on business goals, customer journeys, and reporting requirements.
Website Analytics
Website analytics focuses on understanding visitor behavior, traffic sources, engagement patterns, and user interactions. Businesses can identify which pages attract visitors, which pages lose users, and where improvements may be needed.
Typical analyses include:
- Traffic source analysis.
- Engagement analysis.
- User pathways.
- Page performance.
- Exit pages.
- Session trends.
Conversion Analysis
Conversions represent the actions that matter most to businesses. These actions may include purchases, lead submissions, registrations, or downloads.
Conversion analysis helps answer questions such as:
- Why are leads declining?
- Which pages generate the most conversions?
- Which campaigns contribute to business outcomes?
- Where do visitors abandon the process?
Funnel Analysis
Funnel analysis evaluates the sequence users follow before completing an action. Understanding where users exit the process helps organizations identify bottlenecks and improve customer journeys.
Common funnel stages include:
- Landing page visit.
- Product view.
- Form initiation.
- Checkout process.
- Purchase completion.
Campaign Performance Analysis
Marketing campaigns generate traffic from multiple channels. Campaign analysis helps organizations understand traffic quality, conversion patterns, and channel effectiveness.
This analysis may involve:
- Paid advertising.
- Organic search.
- Email marketing.
- Social media.
- Referral channels.
Marketing Attribution Analysis
Attribution analysis helps businesses understand how different channels contribute to conversions. Because various platforms use different attribution models, interpreting results carefully is essential.
Attribution analysis may include:
- First-touch attribution.
- Last-touch attribution.
- Multi-touch attribution.
- Conversion paths.
- Assisted conversions.
E-Commerce Analytics
E-commerce businesses require visibility into revenue performance and customer purchasing behavior.
Common analyses include:
- Product performance.
- Cart abandonment.
- Checkout activity.
- Revenue trends.
- Customer segments.
- Average order value.
SaaS and Product Analytics
Software and digital products require insights beyond website traffic. Product analytics focuses on user engagement and customer lifecycle activity.
Common areas of analysis include:
- User activation.
- Feature usage.
- Trial-to-paid conversions.
- Retention behavior.
- Subscription trends.
- Churn indicators.
Dashboard and KPI Reporting
Executives and teams require clear reporting systems to monitor performance. KPI reporting helps organizations focus on metrics that support business goals rather than vanity metrics.
Typical KPIs include:
- Leads.
- Conversion rates.
- Revenue.
- Trial activations.
- Purchases.
- Customer acquisition indicators.
- Engagement metrics.
Overview of Digital Analytics Services

Types of Digital Data We Analyze
Digital analytics begins with understanding the information generated across websites, applications, campaigns, e-commerce platforms, and digital products. Different organizations collect different types of data depending on their goals, customer journeys, and reporting requirements. A B2B company may prioritize lead generation metrics, while an online retailer may focus on product views, cart activity, and purchases. Similarly, SaaS businesses often monitor activation rates, engagement patterns, and subscription behavior.
At DataScienceConsultingPro.com, we analyze multiple forms of digital information to help businesses understand what customers are doing, where opportunities exist, and which areas may require improvement. Rather than focusing on isolated metrics, we evaluate how different sources of information work together to explain performance.
Understanding these datasets helps organizations improve decision-making, increase conversion efficiency, and strengthen reporting processes.
Website Traffic Data
Website traffic data provides insight into how visitors discover and interact with a website. Analyzing traffic patterns allows businesses to understand whether visitors are arriving through search engines, paid campaigns, email marketing, social media, or referral channels.
Traffic analysis commonly includes:
- Source and medium performance.
- User engagement patterns.
- Device usage.
- Geographic distribution.
- Session trends.
- Exit pages.
- Landing page performance.
Traffic volume alone does not determine success. High visitor numbers may not lead to business results if traffic quality is poor or if users encounter friction throughout the journey.
Understanding traffic behavior helps organizations optimize content, improve customer experiences, and allocate marketing budgets more effectively.
Conversion Data
Conversions represent meaningful actions performed by users. These actions differ depending on the business model and objectives.
Examples of conversions include:
- Purchases.
- Form submissions.
- Quote requests.
- Newsletter signups.
- Trial registrations.
- Demo requests.
- File downloads.
Conversion analysis helps organizations determine whether traffic is producing business value and reveals opportunities for improving performance.
Businesses often ask questions such as:
- Which pages produce the most leads?
- Why are conversions declining?
- Which campaigns generate customers?
- Where do visitors abandon the process?
Answering these questions helps organizations prioritize improvements that support revenue growth and customer acquisition.
Campaign Performance Data
Marketing campaigns generate information across multiple channels. Evaluating campaign data helps organizations understand how different channels contribute to business outcomes.
Campaign analysis may involve:
- Paid advertising.
- Organic search traffic.
- Social media campaigns.
- Email marketing.
- Referral traffic.
Performance data allows organizations to identify high-performing campaigns and allocate resources more efficiently.
Funnel Data
Customer journeys typically involve several stages before a user converts. Funnel data reveals how individuals move through these stages and where abandonment occurs.
Common funnel stages include:
- Landing page visit.
- Product or service page view.
- CTA interaction.
- Form initiation.
- Purchase or submission.
Analyzing funnel behavior helps organizations identify bottlenecks and optimize experiences that encourage users to complete desired actions.
E-Commerce Data
E-commerce businesses rely on detailed information about products, customers, and transactions. Understanding revenue-related metrics is essential for maximizing profitability and improving shopping experiences.
Common areas of analysis include:
- Product views.
- Add-to-cart events.
- Checkout activity.
- Purchases.
- Revenue.
- Customer segments.
- Average order value.
These insights support pricing decisions, campaign evaluations, and customer retention strategies.
Product and SaaS Usage Data
Software companies and subscription-based businesses require deeper insights into how customers engage with their products after signup.
Product analytics often focuses on:
- User activation.
- Feature adoption.
- Subscription behavior.
- Retention indicators.
- Engagement patterns.
- Trial-to-paid conversions.
Understanding customer behavior after acquisition enables SaaS organizations to improve retention and enhance user experiences.
Customer Journey Data
Modern customer journeys are rarely straightforward. Customers often interact with several touchpoints before converting.
Journey analysis helps organizations understand:
- Entry points.
- Navigation paths.
- Conversion sequences.
- Exit points.
- Multi-channel interactions.
These insights help businesses optimize digital experiences and reduce friction throughout the buying process.
Types of Digital Data and Their Uses
| Data Type | Typical Questions | Analytical Outcome |
|---|---|---|
| Website Traffic | Where do visitors come from? | Traffic analysis |
| Conversion Data | Which actions drive results? | Conversion insights |
| Funnel Data | Where do users abandon? | Funnel analysis |
| Campaign Data | Which channels perform best? | Campaign reporting |
| E-Commerce Data | Which products generate revenue? | Revenue insights |
| Product Usage Data | How do customers engage? | Engagement analysis |
| Customer Journey Data | What paths lead to conversion? | Journey analysis |
Analyzing these datasets together provides a more complete understanding of digital performance than relying on isolated metrics.
Our Digital Analytics Process
Successful digital analytics depends on more than collecting reports. Reliable insights require a structured process that emphasizes data quality, business objectives, and meaningful interpretation.
At DataScienceConsultingPro.com, our approach focuses on transforming raw information into practical recommendations that support better decisions.
Step 1: Business Goal Review
Every project begins with understanding business objectives. Different organizations require different measurements depending on their products, customers, and priorities.
Common objectives include:
- Lead generation.
- Revenue growth.
- Customer acquisition.
- User engagement.
- Subscription activation.
- Retention improvement.
Defining objectives early ensures that analytical efforts remain aligned with business needs.
Step 2: Analytics Review
Before performing deeper analysis, existing measurement systems should be reviewed to identify inconsistencies or tracking issues.
Areas commonly reviewed include:
- Analytics platforms.
- Event tracking.
- Conversion definitions.
- Campaign parameters.
- Reporting structures.
Reliable decisions depend on reliable measurements.
Step 3: KPI Definition
Organizations often collect more metrics than necessary. Defining key performance indicators helps focus attention on measurements that matter most.
Common KPIs include:
- Qualified leads.
- Conversion rates.
- Revenue.
- Purchases.
- Trial activations.
- Customer acquisition metrics.
Strong KPI frameworks improve reporting clarity and facilitate decision-making.
Step 4: Data Validation
Before interpreting results, the quality of the underlying data must be verified.
Validation activities may include:
- Reviewing event accuracy.
- Identifying duplicate measurements.
- Checking attribution inconsistencies.
- Evaluating conversion counts.
- Detecting missing information.
Data quality plays a critical role in ensuring trustworthy insights.
Step 5: Performance Analysis
Once data quality has been confirmed, analytical techniques are applied to uncover patterns and opportunities.
Performance analysis may focus on:
- User behavior.
- Traffic quality.
- Conversion trends.
- Campaign effectiveness.
- Revenue patterns.
- Funnel progression.
The goal is to understand what is happening and why.
Step 6: Reporting and Recommendations
The final stage involves translating analytical findings into practical recommendations.
Deliverables may include:
- Executive summaries.
- Dashboard-ready reports.
- KPI frameworks.
- Campaign evaluations.
- Funnel reports.
- Technical recommendations.
Strong reporting helps stakeholders understand not only what happened but also which actions may improve future performance.
Digital Analytics Workflow
| Step | Purpose |
|---|---|
| Business Goal Review | Understand objectives |
| Analytics Review | Evaluate measurement systems |
| KPI Definition | Identify important metrics |
| Data Validation | Improve reliability |
| Performance Analysis | Generate insights |
| Reporting and Recommendations | Support decisions |
Organizations that follow a structured analytical framework are generally better equipped to optimize performance and maximize the value of their digital information.
Digital Analytics Process
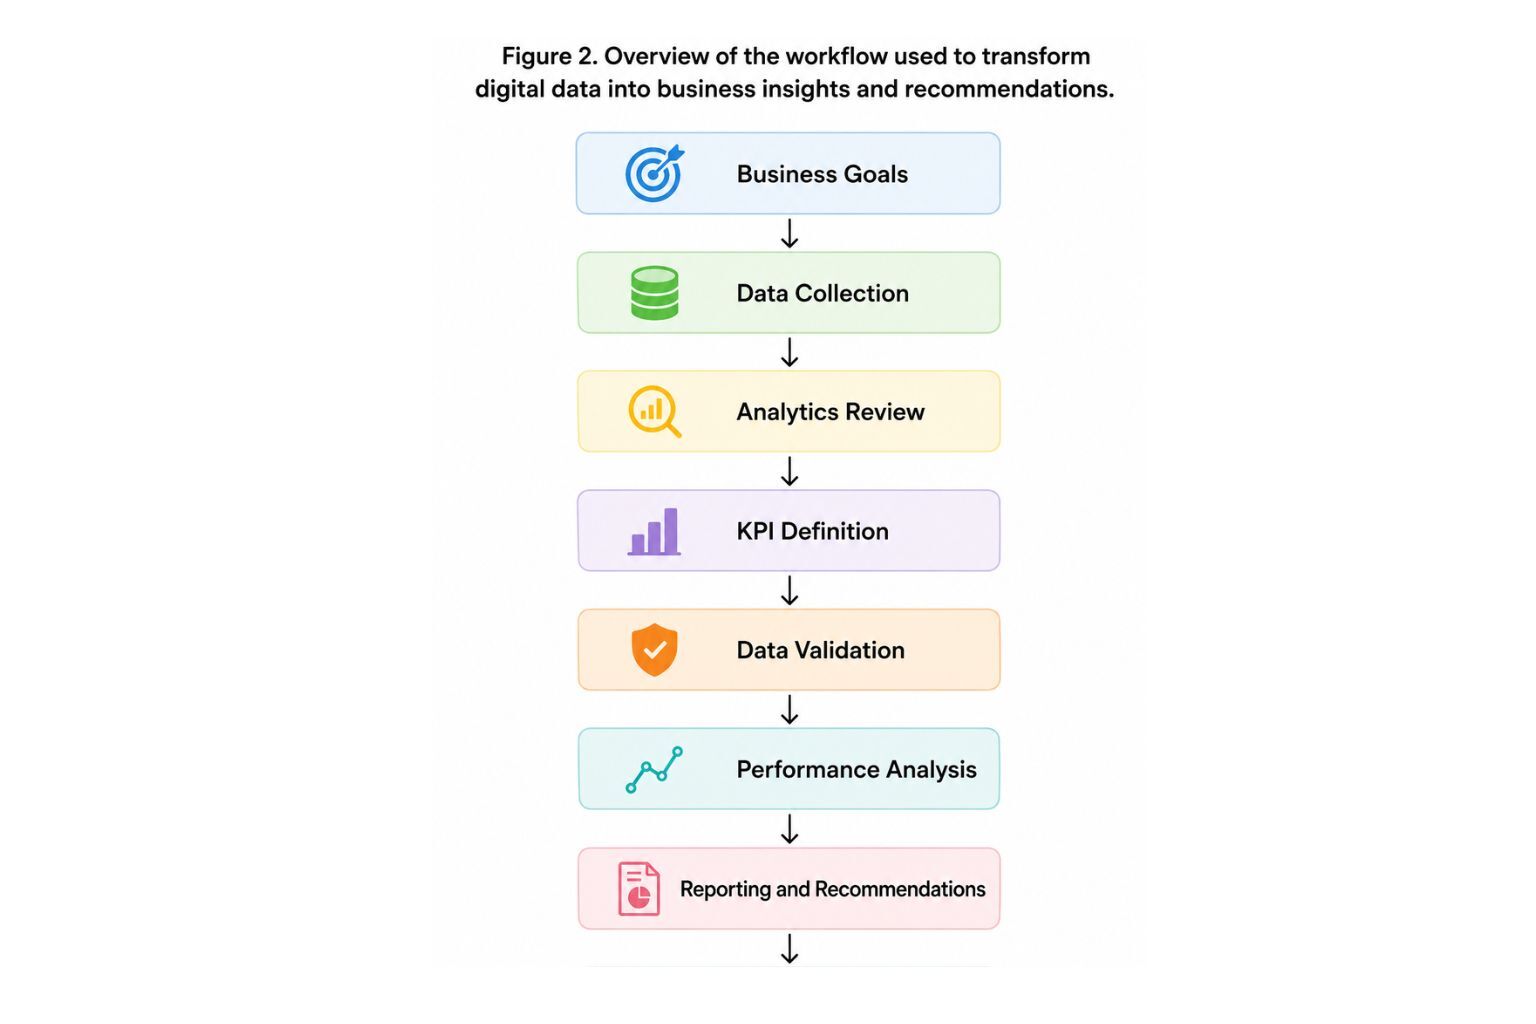
The figure illustrates how digital analytics converts raw information into meaningful insights that support optimization, performance improvement, and strategic decision-making.
Conversion Analysis
Traffic alone does not determine digital success. Organizations may attract thousands of visitors every month and still struggle to generate leads, sales, or customer engagement. Conversion analysis helps businesses understand whether users are completing the actions that matter most and reveals opportunities for improving performance.
A conversion represents a meaningful action performed by a visitor. Depending on the business model, conversions may include purchases, quote requests, registrations, newsletter subscriptions, downloads, demo requests, or trial signups. Examining conversion patterns enables organizations to understand which channels, campaigns, and pages contribute to business outcomes.
Rather than focusing only on the number of conversions, businesses should also understand why customers convert and what factors may prevent additional conversions. Conversion analysis provides insights into customer behavior and supports continuous optimization.
Questions Conversion Analysis Helps Answer
- Which pages generate the highest number of leads?
- Why are conversion rates declining?
- Which channels produce the best results?
- Which campaigns contribute most to revenue?
- Where are visitors abandoning the process?
Understanding these questions enables organizations to allocate resources more effectively and improve customer acquisition.
Benefits of Conversion Analysis
| Benefit | Business Impact |
|---|---|
| Improved understanding of customer behavior | Better customer experiences |
| Identification of high-performing pages | Increased conversions |
| Stronger campaign evaluation | Better marketing efficiency |
| Detection of friction points | Reduced abandonment |
| Improved reporting | Better decision-making |
Organizations that regularly analyze conversions are better positioned to optimize digital performance and maximize return on investment.
Funnel Analysis
Most customer journeys involve several stages before a user completes an action. Funnel analysis examines how visitors move through these stages and identifies where users abandon the process.
For example, an e-commerce funnel may include:
- Product view.
- Add-to-cart event.
- Checkout initiation.
- Payment stage.
- Purchase completion.
Similarly, a lead-generation funnel may involve:
- Landing page visit.
- Call-to-action click.
- Form initiation.
- Form submission.
Each stage provides valuable information about customer behavior. When visitors abandon the process, businesses can investigate potential causes and implement improvements.
Common funnel metrics include:
- Funnel completion rates.
- Drop-off percentages.
- Customer progression.
- Conversion rates.
- Exit points.
- Step-to-step engagement.
These measurements provide insight into customer experiences and reveal opportunities for optimization.
Advantages of Funnel Analysis
| Benefit | Business Value |
|---|---|
| Reduced abandonment | Increased conversion rates |
| Better understanding of customer journeys | Improved user experiences |
| Identification of bottlenecks | Faster optimization |
| Improved reporting | Stronger decisions |
| Greater efficiency | Better performance |
Funnel analysis provides visibility into customer journeys and helps organizations understand where improvements may have the greatest impact.
Landing Page Analysis
Landing pages often represent the first interaction between customers and a business. Even websites with substantial traffic may experience poor performance if visitors fail to engage or complete desired actions.
Landing page analysis evaluates how users interact with individual pages and helps organizations understand which elements influence performance.
Areas commonly examined include:
- Traffic quality.
- Engagement metrics.
- User behavior.
- Form performance.
- Call-to-action effectiveness.
- Exit patterns.
- Conversion rates.
Many businesses discover that declining performance is caused not by insufficient traffic but by issues affecting the user experience.
Common problems identified through landing page analysis include:
- Weak messaging.
- Poor page structure.
- Slow loading speed.
- Ineffective calls to action.
- Low-quality traffic.
- Excessively complex forms.
Optimizing landing pages can significantly improve lead generation and customer acquisition without increasing advertising expenditures.
Questions Landing Page Analysis Helps Answer
| Question | Analytical Insight |
|---|---|
| Which pages convert most effectively? | Identification of high-performing pages |
| Why are visitors leaving? | Exit behavior analysis |
| Which traffic sources deliver quality visitors? | Traffic evaluation |
| Which calls to action perform best? | CTA effectiveness analysis |
| Why are conversions declining? | User experience insights |
Landing page analysis enables organizations to maximize the value of existing traffic and improve customer engagement.
Comparison Between Conversion Analysis, Funnel Analysis, and Landing Page Analysis
Although these analytical approaches are closely related, each focuses on a different aspect of digital performance.
| Area | Primary Focus | Key Question |
|---|---|---|
| Conversion Analysis | Outcomes and desired actions | Are visitors converting? |
| Funnel Analysis | Customer journey progression | Where are users abandoning? |
| Landing Page Analysis | Page-level performance | Why are visitors leaving? |
Businesses often achieve the greatest value when these approaches are combined because they provide a more comprehensive understanding of customer behavior.
How These Analytical Approaches Work Together
These analytical methods should not be viewed as isolated activities. Instead, they form a connected framework that supports continuous optimization.
- Landing pages attract visitors.
- Customers move through the funnel.
- Conversions occur at the final stage.
- Analytical insights reveal opportunities.
- Businesses optimize experiences and improve results.
Understanding the relationship between these areas helps organizations make better decisions and strengthen digital performance.
Comparison of Analytical Approaches
| Analytical Approach | Purpose | Typical Outcome |
|---|---|---|
| Conversion Analysis | Evaluate meaningful actions | Improved conversion rates |
| Funnel Analysis | Identify abandonment points | Reduced drop-offs |
| Landing Page Analysis | Assess page performance | Increased engagement |
| Customer Journey Analysis | Understand navigation patterns | Better user experiences |
| Campaign Analysis | Evaluate channel effectiveness | Improved marketing ROI |
Together, these analytical approaches provide a more complete understanding of customer behavior and support stronger decision-making.
E-Commerce Analytics Services
E-commerce businesses generate large amounts of digital information through customer interactions, product views, shopping carts, checkouts, and completed purchases. Understanding how users behave throughout the buying journey is essential for improving customer experiences and maximizing revenue.
Our e-commerce analytics services help businesses evaluate performance across online stores and identify opportunities for increasing sales and reducing abandonment. Rather than focusing solely on revenue figures, e-commerce analytics examines customer behavior before, during, and after a transaction.
Organizations can use these insights to improve product pages, optimize checkout processes, evaluate marketing campaigns, and strengthen customer retention strategies.
Common areas of analysis include:
- Product performance.
- Shopping cart behavior.
- Checkout completion.
- Revenue trends.
- Customer segmentation.
- Average order value.
- Purchase frequency.
- Repeat customer behavior.
Understanding these patterns enables organizations to make more informed decisions and improve profitability.
Questions E-Commerce Analytics Helps Answer
| Question | Analytical Insight |
|---|---|
| Which products generate the most revenue? | Product performance analysis |
| Why are customers abandoning carts? | Cart abandonment analysis |
| Which channels drive sales? | Marketing performance evaluation |
| What is the average order value? | Revenue analysis |
| Which customers purchase repeatedly? | Customer retention insights |
Businesses that understand these patterns are often better positioned to increase conversions and maximize the value of existing customers.
SaaS and Product Analytics Services
Software companies and subscription-based businesses require analytical approaches that extend beyond website traffic and transactions. Product analytics focuses on how users interact with digital products and helps organizations understand customer behavior after acquisition.
Our product analytics services help businesses evaluate user engagement, feature adoption, and customer retention to support sustainable growth.
Areas commonly analyzed include:
- User onboarding.
- Feature usage.
- Engagement behavior.
- Trial-to-paid conversions.
- Subscription activity.
- Churn indicators.
- Retention patterns.
Product analytics helps organizations understand whether customers are finding value and where improvements may enhance user experiences.
Benefits of Product Analytics
| Benefit | Business Impact |
|---|---|
| Improved onboarding | Faster user activation |
| Better understanding of customer behavior | Increased engagement |
| Identification of churn risks | Higher retention |
| Feature usage insights | Product improvements |
| Stronger reporting | Better decisions |
Organizations that continuously evaluate product usage are generally better equipped to improve customer experiences and maintain long-term growth.
Marketing Attribution Analysis
Modern customer journeys often involve multiple interactions before a conversion occurs. Customers may discover a brand through search engines, social media, paid campaigns, or email marketing before finally completing an action.
Marketing attribution analysis helps businesses understand how different channels contribute to customer acquisition and revenue generation.
Common attribution models include:
- First-touch attribution.
- Last-touch attribution.
- Linear attribution.
- Time-decay attribution.
- Multi-touch attribution.
Understanding channel contributions enables organizations to allocate resources more effectively and optimize marketing investments.
Questions Attribution Analysis Helps Answer
| Question | Analytical Insight |
|---|---|
| Which channels influence conversions? | Attribution evaluation |
| Which campaigns produce revenue? | Campaign effectiveness |
| Where should budgets be allocated? | Investment optimization |
| Which touchpoints contribute most? | Customer journey analysis |
Marketing attribution helps organizations move beyond simplistic reporting and develop a more comprehensive understanding of customer acquisition.
Industries We Support
Digital analytics provides value across many industries because every organization benefits from understanding customer behavior and performance.
Our digital analytics services support:
E-Commerce Businesses
Online retailers require visibility into customer behavior, product performance, and revenue trends.
SaaS Companies
Software providers benefit from understanding user engagement, retention, and feature adoption.
Healthcare Organizations
Healthcare institutions often require analytics to evaluate website performance, appointment requests, and patient engagement.
Educational Institutions
Universities and training providers use analytics to evaluate website interactions, enrollment behavior, and digital campaigns.
Financial Services
Financial organizations rely on digital insights to improve customer acquisition and optimize online experiences.
Professional Services
Consultants, law firms, and agencies often use analytics to understand lead generation and marketing performance.
Nonprofit Organizations
Nonprofits can evaluate donor behavior and improve campaign effectiveness through digital analytics.
Industries and Analytical Objectives
| Industry | Common Objectives |
|---|---|
| E-Commerce | Increase revenue and reduce cart abandonment |
| SaaS | Improve activation and retention |
| Healthcare | Enhance patient engagement |
| Education | Increase enrollment |
| Finance | Strengthen customer acquisition |
| Professional Services | Generate qualified leads |
| Nonprofits | Improve fundraising performance |
Tools and Platforms We Support
Reliable analysis depends on accurate measurement and reporting systems. Our digital analytics services support a variety of platforms used by modern organizations.
Common platforms include:
- Google Analytics 4.
- Google Tag Manager.
- Looker Studio.
- BigQuery.
- Power BI.
- Tableau.
- Shopify.
- WooCommerce.
- SQL databases.
- Python-based analytics tools.
The objective is not simply to use tools but to ensure that businesses obtain meaningful insights from their data.
Signs Your Business Needs Digital Analytics Services
Many organizations collect large amounts of data but struggle to convert information into actionable insights. Several indicators suggest that additional analytical support may be beneficial.
Common signs include:
- Reports are difficult to interpret.
- Conversions are declining.
- Marketing ROI is unclear.
- Funnel abandonment rates are increasing.
- Campaign performance varies significantly.
- Dashboards provide inconsistent results.
- Revenue trends are difficult to explain.
- Stakeholders lack visibility into KPIs.
Addressing these challenges through digital analytics can improve decision-making and strengthen business performance.
Common Business Challenges and Analytical Solutions
| Challenge | Analytical Solution |
|---|---|
| Declining conversions | Conversion analysis |
| High abandonment rates | Funnel analysis |
| Poor campaign performance | Campaign evaluation |
| Inconsistent reporting | Data validation |
| Weak customer retention | Product analytics |
| Unclear ROI | Attribution analysis |
Pricing Factors for Digital Analytics Services
The cost of digital analytics projects varies depending on several factors. Because organizations have different objectives and data environments, analytical requirements differ from one project to another.
Factors affecting project scope include:
- Number of platforms involved.
- Data complexity.
- Reporting requirements.
- Business objectives.
- Analytical depth.
- Frequency of reporting.
- Dashboard requirements.
Organizations seeking advanced analytical support may require more extensive evaluations and customized reporting solutions.
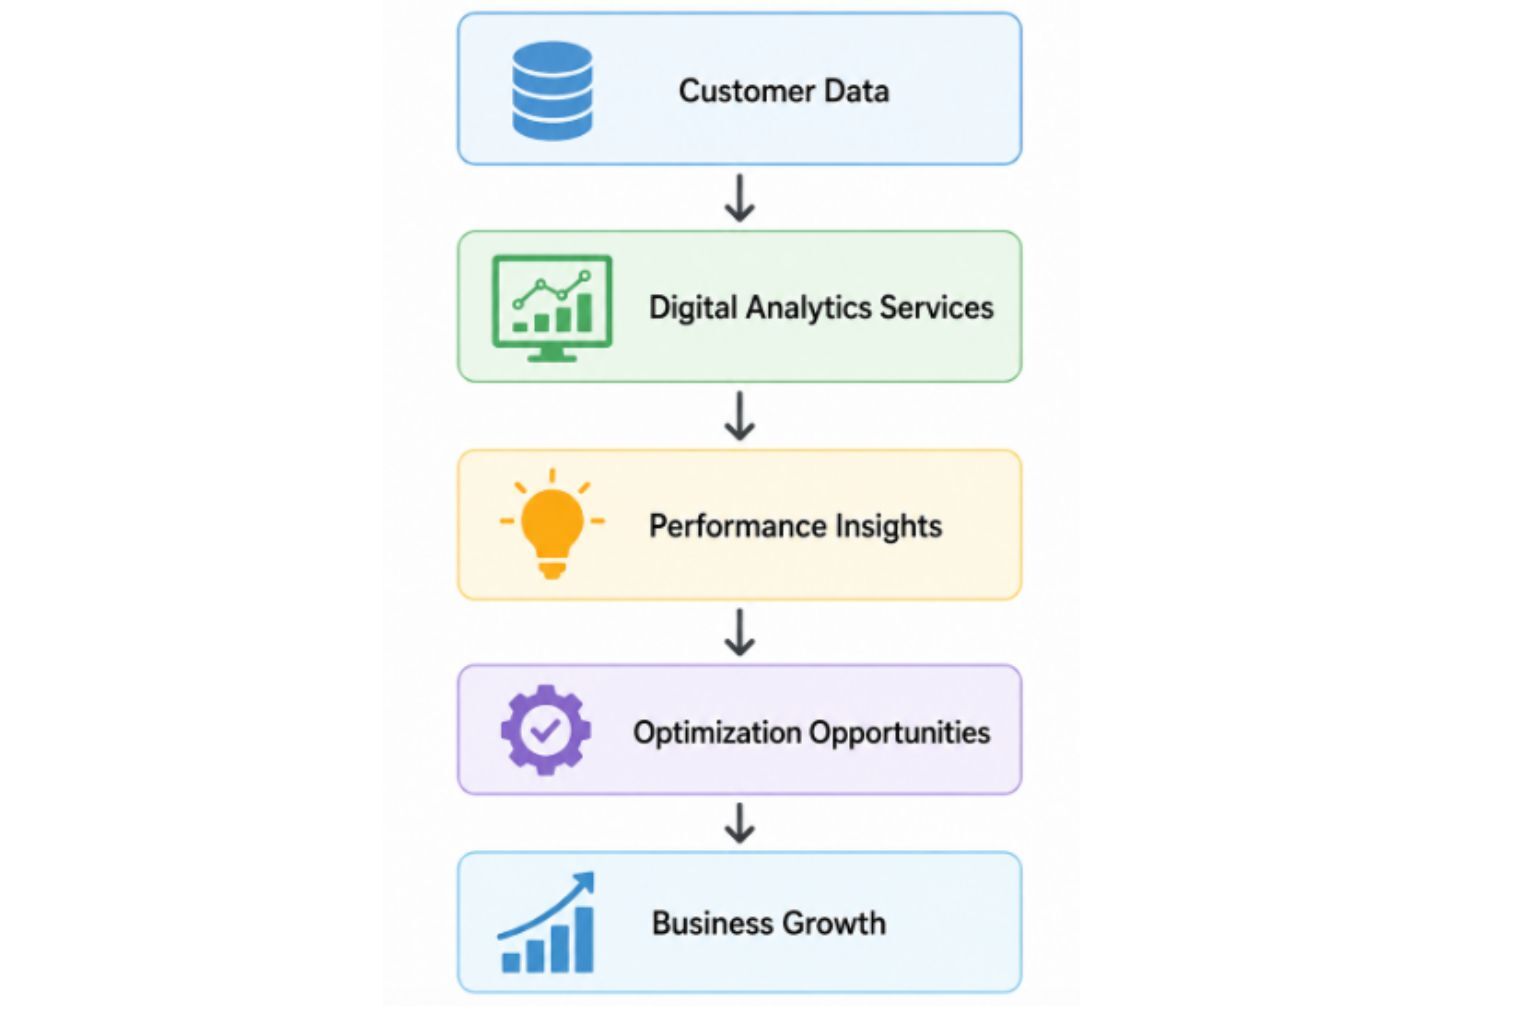
The figure illustrates how analytical processes convert digital information into practical recommendations that support customer acquisition, revenue growth, and long-term business success.
What Clients Receive
Organizations investing in digital analytics services need more than raw reports. They require meaningful insights that support strategic decision-making and help improve performance. At DataScienceConsultingPro.com, our digital analytics services are designed to provide clear, actionable deliverables tailored to the goals of each project.
Depending on the scope and objectives, clients may receive:
- Digital analytics assessments.
- KPI frameworks.
- Conversion analysis reports.
- Funnel performance evaluations.
- Campaign effectiveness reports.
- Attribution analysis summaries.
- Dashboard recommendations.
- Executive summaries.
- Performance insights and recommendations.
- Data quality assessments.
The objective is not simply to deliver information but to provide practical insights that help organizations optimize digital performance and make better business decisions.
Typical Deliverables
| Deliverable | Purpose |
|---|---|
| Analytics assessment | Evaluate existing measurement systems |
| KPI framework | Identify meaningful metrics |
| Conversion reports | Understand customer actions |
| Funnel analysis reports | Identify abandonment points |
| Campaign evaluations | Measure marketing performance |
| Dashboard recommendations | Improve reporting visibility |
| Executive summaries | Support decision-making |
Why Choose DataScienceConsultingPro.com?
Organizations often collect large amounts of data but struggle to transform information into actionable insights. Our consulting approach focuses on helping businesses understand customer behavior, evaluate performance, and identify opportunities for growth.
Several factors distinguish our approach:
Business-Focused Analysis
Analytics should support business objectives rather than simply generate reports. We emphasize practical insights that help organizations improve performance and achieve measurable outcomes.
Structured Analytical Framework
Reliable decisions require reliable processes. Our analytical framework emphasizes data quality, validation, and meaningful interpretation.
Customized Solutions
Different businesses have different objectives and challenges. We tailor our analytical approach to the specific needs of each organization rather than relying on generic reports.
Multiple Industry Experience
Digital analytics principles apply across industries, including e-commerce, SaaS, healthcare, education, professional services, and nonprofit organizations.
Emphasis on Data Quality
Poor decisions often result from poor data. Ensuring the accuracy and consistency of information is essential for generating reliable insights.
Why Organizations Seek Digital Analytics Support
| Challenge | Analytical Benefit |
|---|---|
| Declining conversions | Better understanding of customer behavior |
| High abandonment rates | Improved funnel performance |
| Weak campaign results | More efficient marketing investments |
| Poor reporting visibility | Stronger KPI frameworks |
| Unclear customer journeys | Better decision-making |
| Inconsistent metrics | Improved data quality |
Request Digital Analytics Services
Understanding customer behavior requires more than collecting reports. Businesses need reliable measurements, meaningful insights, and practical recommendations that support better decisions.
Whether your organization requires assistance with:
- Conversion analysis.
- Funnel evaluation.
- Campaign reporting.
- Customer journey analysis.
- Marketing attribution.
- Product analytics.
- Dashboard development.
- Performance reporting.
Our digital analytics services are designed to help organizations transform digital information into business intelligence.
If you are seeking professional support, we encourage you to request a quote and discuss your project requirements.
Frequently Asked Questions
Digital analytics services involve collecting, evaluating, interpreting, and reporting information generated by websites, applications, campaigns, and digital platforms. The objective is to understand customer behavior, improve performance, and support strategic decision-making.
Digital analytics helps organizations understand how users interact with websites and products. These insights support better decisions, stronger customer experiences, improved marketing efficiency, and increased conversions.
Digital analytics provides value across numerous industries, including e-commerce, SaaS, healthcare, education, finance, consulting, and nonprofit organizations. Any organization seeking to understand customer behavior and improve performance can benefit from analytical insights.
Yes. Conversion analysis helps organizations understand customer behavior, identify friction points, and optimize experiences. Improving customer journeys often leads to increased conversions and stronger business performance.
Funnel analysis examines the sequence of steps customers follow before completing an action. Understanding where visitors abandon the process helps businesses identify opportunities for optimization and improve customer experiences.
Marketing attribution evaluates how different channels contribute to customer acquisition and conversions. Attribution analysis helps organizations understand which campaigns and touchpoints influence business outcomes.
Yes. E-commerce analytics provides insights into customer behavior, revenue trends, cart abandonment, and product performance. These insights help businesses optimize shopping experiences and improve profitability.
Common platforms include Google Analytics 4, Google Tag Manager, Looker Studio, BigQuery, Tableau, Power BI, Shopify, WooCommerce, SQL databases, and Python analytics tools.
Pricing depends on factors such as the number of platforms involved, reporting requirements, project complexity, business objectives, and analytical depth.
Reliable decisions depend on reliable information. Data quality helps ensure that analytical insights are accurate and that organizations make decisions based on trustworthy measurements.
Conclusion
Digital analytics services help organizations understand customer behavior, evaluate performance, and identify opportunities for growth. By transforming raw digital information into meaningful insights, businesses can make better decisions, improve customer experiences, and optimize marketing investments.
Whether the objective is increasing conversions, improving customer retention, evaluating campaigns, or strengthening reporting systems, digital analytics provides the foundation for data-driven decision-making.
Organizations that invest in understanding their data are often better positioned to achieve sustainable growth and adapt to changing customer expectations.
