
Risk information trapped in spreadsheets, disconnected systems, and annual reviews makes it hard to see problems before they grow. Risk analytics consulting turns operational, financial, vendor, and compliance data into measurable risk indicators, models, and dashboards, so leaders can spot exposure earlier and act with better information.
This service is built for chief risk officers, CFOs, COOs, internal audit and compliance teams, and operations leaders who need more than a static risk register. Every engagement is scoped to your data, your risk categories, and your reporting needs, with clear deliverables and confidential handling of all business information.
Request a Risk Analytics Assessment → Discuss Your Risk Data →
We tailor scope to your organization’s size, data maturity, and risk priorities. There are no fixed packages assumed in advance, and no promise that analytics can remove uncertainty. What we deliver is clearer visibility, quantified exposure, and a defensible process behind every risk decision.
Why organizations trust this approach:
- Business focused risk analysis, not generic reporting
- Custom key risk indicators built around your operations
- Explainable analytical methods. No black box scoring
- Dashboard ready reporting for executives and risk owners
- Human reviewed recommendations before any output is delivered
- Confidential handling of all data shared during an engagement
What Is Risk Analytics Consulting?
Risk analytics consulting is the use of business data, statistical analysis, visualization, and modeling to help organizations identify, measure, monitor, and respond to uncertainty. It combines business context with historical data, risk indicators, scenario testing, and reporting so that risk decisions are based on evidence rather than intuition alone.
Risk analytics does not eliminate uncertainty. It does not guarantee that losses, fraud, defaults, disruptions, or compliance incidents will never occur. It is a decision support discipline: it improves the information available to the people who ultimately manage risk.
Two widely referenced frameworks shape how organizations typically structure this work: ISO 31000, which provides generic principles and guidelines for managing risk across any type of organization, and the COSO Enterprise Risk Management framework, which links risk management to strategy and performance. Neither framework is specific to analytics, and following them does not by itself guarantee any particular outcome. They simply provide a common vocabulary and structure that risk analytics work can support.
A risk analytics engagement typically combines:
- Business context: objectives, risk appetite, and the decisions the analysis needs to support
- Historical data: transactions, incidents, vendor records, and operational logs
- Statistical analysis: trend, correlation, and probability based methods
- Risk indicators: measurable signals tied to specific risk categories
- Scenario modeling: testing how assumptions and conditions change exposure
- Visualization: dashboards and reports that make risk visible
- Monitoring: ongoing tracking so indicators stay current
- Decision support: clear outputs that inform, not replace, human judgment
Key Risk Terminology
| Term | Definition |
|---|---|
| Risk | A potential event that could negatively affect objectives |
| Issue | A risk that has begun to materialize or requires active attention |
| Incident | An event that has already occurred and produced impact |
| Control | A process or safeguard intended to reduce likelihood or impact |
| Key risk indicator (KRI) | A measurable signal that tracks change in a specific risk over time |
| Risk score | A relative measure combining likelihood, impact, and other factors |
| Risk scenario | A defined set of assumptions used to test potential outcomes |
| Mitigation action | A specific step taken to reduce exposure or improve control effectiveness |
Why Organizations Need Risk Analytics
| Current Problem | Business Consequence | Risk Analytics Response |
|---|---|---|
| Risk register updated once a year | Emerging risks go unnoticed for months | Continuous KRI monitoring with scheduled refresh |
| Manual spreadsheet reporting | Time lost, inconsistent formulas, version errors | Automated, repeatable risk data pipelines |
| Subjective red amber green ratings | Ratings vary by department and reviewer | Defined, documented scoring methodology |
| Data siloed across systems | No enterprise view of exposure | Consolidated risk data assessment and reporting |
| Reporting only after incidents occur | Reactive, not preventive, decision making | Leading indicators and threshold alerts |
| Too many metrics, no prioritization | Leadership attention spread too thin | Focused KRI catalogue tied to risk appetite |
| Risk models built once, never reviewed | Model accuracy degrades silently over time | Ongoing model monitoring and drift review |
Our Risk Analytics Consulting Services
Risk Analytics Strategy We start by connecting your business objectives, key decisions, stakeholders, and risk appetite to an analytics roadmap, identifying which risk categories matter most and what data is available to support them.
Risk Data Assessment Before building anything, we assess your existing data sources: completeness, historical depth, update frequency, ownership, and suitability for risk analysis. Where broader data cleanup is required, we can refer this to our data cleaning and preparation services.
Risk Taxonomy and Measurement Design We help define risk categories and subcategories, likelihood and impact scales, thresholds, and reporting logic, creating a shared risk language across departments. This is scoped narrowly to risk measurement, not full enterprise data governance, which is available as a separate service.
Key Risk Indicator Development We select, define, and document KRIs, assign thresholds, and connect each indicator to a specific management action, so a breach triggers a response, not just a report.
Risk Scoring Models We build transparent scoring approaches based on likelihood, impact, severity, exposure, frequency, and control strength. Risk scores are decision support tools, not guarantees of outcome.
Predictive Risk Modeling Where historical data supports it, we estimate the probability of risk specific outcomes, such as default, disruption, delay, failure, churn related revenue risk, or fraud indicators. For general business forecasting outside a risk context, see our predictive analytics services.
Scenario and Sensitivity Analysis We test how changes in variables (demand, cost, supplier performance, market conditions) affect exposure, helping leaders understand a range of outcomes rather than a single number.
Stress Testing Analytics We support general business stress testing to understand resilience under adverse conditions. Regulated financial stress testing, the kind subject to standards published by bodies such as the Basel Committee on Banking Supervision, may require specialized legal, regulatory, actuarial, or supervisory expertise beyond this engagement.
Anomaly and Exception Detection We identify unusual transactions, performance shifts, or process exceptions for human review. Not every anomaly indicates fraud or wrongdoing. Flagged items are inputs to investigation, not conclusions.
Operational Risk Analytics Coverage includes process failures, delays, defect rates, staffing gaps, capacity constraints, downtime, and control exceptions.
Financial Risk Analytics Coverage includes cash flow pressure, revenue concentration, cost volatility, margin exposure, and budget variance monitoring. This is not investment advice.
Credit Risk Analytics Coverage includes customer segmentation, payment behavior, delinquency indicators, and portfolio concentration. We do not provide regulated credit decisions unless independently verified for your context.
Fraud Risk Analytics Coverage includes rule based monitoring, anomaly detection, transaction patterns, and exception queues that support investigation teams. We do not promise fraud prevention or make accusations based solely on a model output.
Vendor and Third Party Risk Analytics Coverage includes vendor concentration, delivery performance, incident frequency, contract indicators, and financial exposure monitoring.
Supply Chain Risk Analytics Coverage includes supplier dependency, delivery variability, inventory exposure, geographic concentration, and disruption scenario testing.
Compliance Analytics We help monitor patterns, exceptions, and control indicators that support compliance teams. This does not constitute legal advice, an audit opinion, or a compliance certification.
Model Risk and Monitoring We support ongoing review of model assumptions, performance, calibration, explainability, and drift, helping ensure models stay reliable after deployment. Regulated financial institutions may separately be subject to formal supervisory expectations for model risk management, such as the Federal Reserve’s SR 11-7 guidance; this engagement supports sound modeling practice but does not itself satisfy a specific regulatory requirement.
Risk Dashboards and Executive Reporting Interactive dashboards presenting top risks, exposure by category, KRI status, threshold alerts, trends, and mitigation progress, built to support specific risk decisions, not as generic visualization.
Continuous Risk Monitoring Recurring data refreshes, indicator updates, alerts, and escalation workflows keep risk information current between formal review cycles.
Request a Risk Analytics Assessment →
Types of Risk Analytics
| Type | Main Question | Typical Method | Example Output | Best Use | Limitation |
|---|---|---|---|---|---|
| Descriptive | What is happening now? | Summary statistics, trend charts | Risk exposure summary | Baseline visibility | Doesn’t explain causes |
| Diagnostic | Why did it happen? | Correlation, root cause analysis | Driver analysis report | Understanding incidents | Correlation isn’t causation |
| Predictive | What might happen next? | Regression, classification | Probability of default/delay | Early warning signals | Based on historical patterns only |
| Prescriptive | What should we do? | Decision rules, optimization | Recommended action list | Prioritizing mitigation | Still requires human judgment |
| Scenario based | What if conditions change? | Sensitivity, simulation | Best/moderate/severe case outputs | Planning under uncertainty | Depends on assumption quality |
| Real time monitoring | What is changing right now? | Threshold alerts, streaming checks | Live dashboard alerts | Fast moving operational risk | Requires reliable live data feeds |
Risk Analytics Maturity Model

Not every organization needs the most advanced level. The right level depends on risk complexity, data availability, and decision needs.
- Manual and Reactive. Spreadsheet based, annual reviews, no consistent definitions. Limitation: risks surface only after impact. Next step: standardize risk definitions and reporting cadence.
- Standardized Risk Reporting. Common templates, defined categories, periodic reporting. Limitation: still largely manual and backward looking. Next step: centralize data into a shared reporting view.
- Centralized Risk Dashboards. Consolidated data, visual reporting, defined KRIs. Limitation: limited forward looking or scenario capability. Next step: introduce predictive and scenario based methods.
- Predictive and Scenario Based Analytics. Probability models, sensitivity testing, early warning indicators. Limitation: models may not be monitored after deployment. Next step: build formal model monitoring and governance.
- Integrated Continuous Monitoring. Real time or near real time alerts, automated indicator refresh, ongoing model review. Limitation: requires sustained data quality and governance investment. Next step: refine thresholds and expand coverage as needs evolve.
Risk Analytics Process
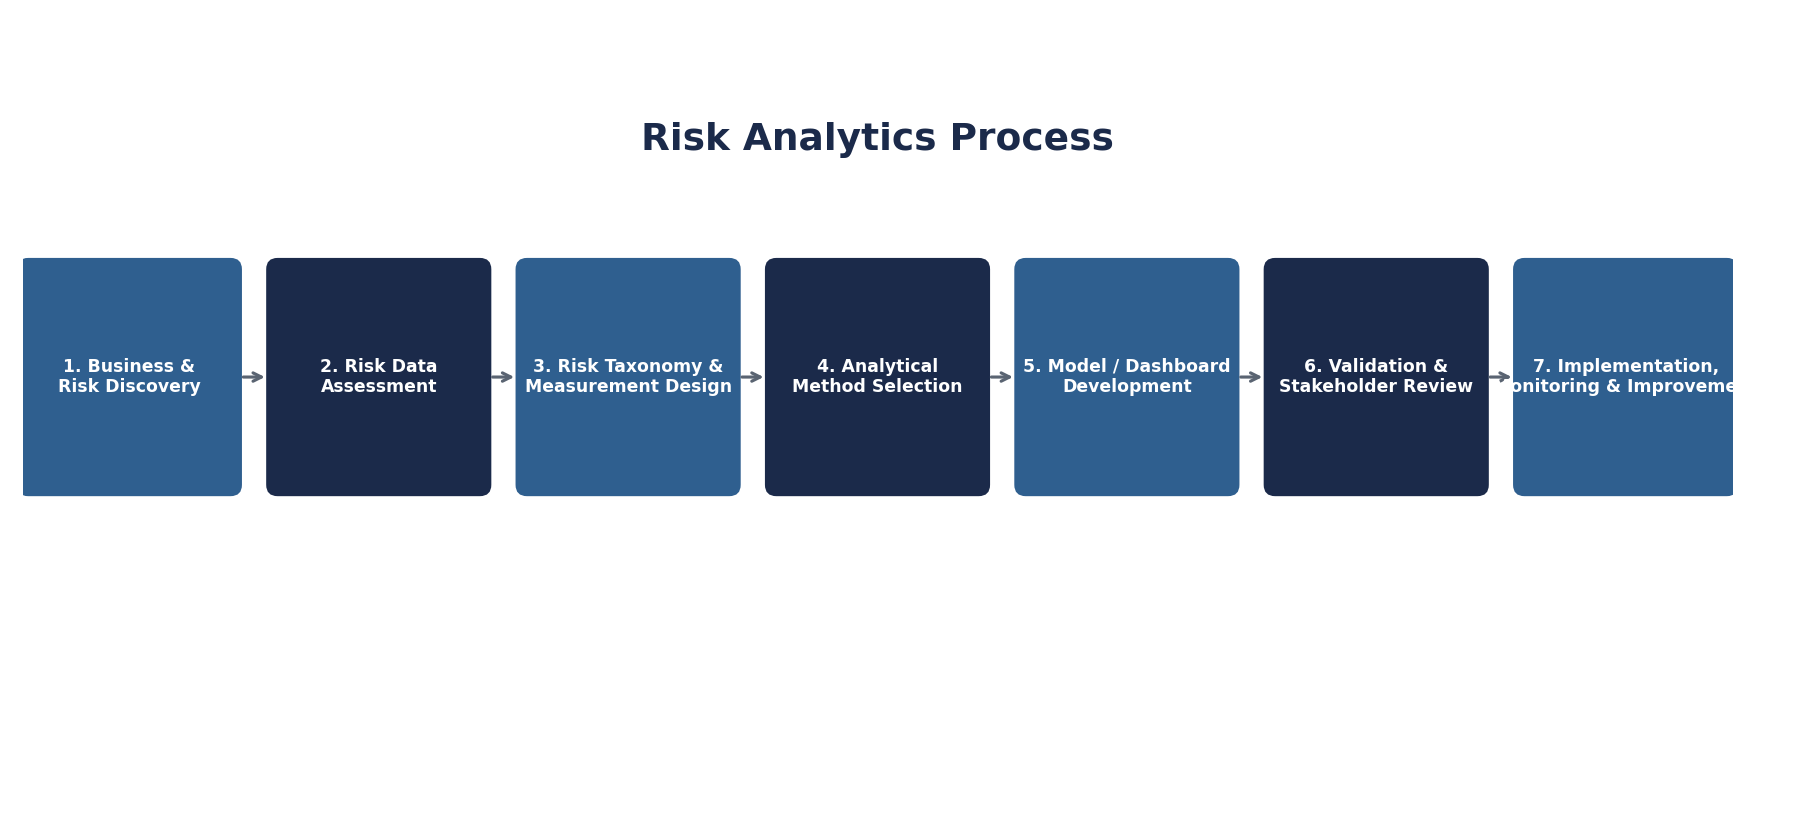
| Step | Main Activities | Client Input | Deliverable | Quality Checkpoint |
|---|---|---|---|---|
| 1. Business and risk discovery | Clarify objectives, decisions, risk appetite | Stakeholder access, priorities | Discovery summary | Stakeholder sign off |
| 2. Risk data and reporting assessment | Inventory data sources, quality, gaps | Data access, system list | Data assessment report | Data suitability review |
| 3. Risk taxonomy and measurement design | Define categories, scales, thresholds | Review of draft taxonomy | Risk measurement framework | Cross department alignment |
| 4. Analytical method selection | Match methods to risk questions | Confirm priorities | Method selection memo | Feasibility check |
| 5. Model, dashboard, or reporting development | Build scoring, models, dashboards | Feedback on prototypes | Working model/dashboard | Technical validation |
| 6. Validation and stakeholder review | Test accuracy, review with users | Business review sessions | Validation report | Stakeholder approval |
| 7. Implementation, monitoring, and improvement | Deploy, monitor, refine | Ongoing feedback | Monitoring plan | Scheduled review cadence |
Risk Data Sources
Risk analytics can draw on financial records, transactions, customer accounts, CRM information, operational logs, incident records, vendor records, supply chain data, quality control data, claims, payment history, compliance exceptions, audit findings, support tickets, workforce metrics (where legally appropriate), market or economic data, equipment and maintenance records, cybersecurity event summaries supplied by authorized teams, existing risk registers, and control assessments.
Data availability, quality, legality, representativeness, and relevance all affect what analysis is realistically possible. An honest data assessment is always the first step.
Analytical Methods
| Method | What It Does | When Useful | Output | Limitation |
|---|---|---|---|---|
| Descriptive statistics | Summarizes data patterns | Baseline understanding | Averages, distributions | Doesn’t explain causes |
| Trend analysis | Tracks change over time | Monitoring direction of risk | Trend charts | Sensitive to short time windows |
| Segmentation | Groups similar entities | Comparing risk across units | Segment profiles | Group boundaries can be arbitrary |
| Correlation analysis | Measures relationships between variables | Identifying related factors | Correlation matrix | Not evidence of causation |
| Regression | Models relationships to predict outcomes | Estimating risk drivers | Coefficient estimates | Assumes relationship stability |
| Classification | Sorts cases into risk categories | Flagging likely outcomes | Risk category labels | Accuracy depends on data quality |
| Time series analysis | Studies sequential data patterns | Forecasting risk trends | Forecast bands | Past patterns may not repeat |
| Survival analysis | Estimates time to event probability | Default or failure timing | Time to event curves | Requires sufficient event history |
| Probability modeling | Estimates likelihood of outcomes | Risk scoring | Probability estimates | Estimates, not certainties |
| Decision trees | Maps decision logic | Explainable classification | Rule based paths | Can overfit small datasets |
| Anomaly detection | Flags unusual patterns | Fraud/exception monitoring | Exception list | Requires human review |
| Clustering | Groups data without predefined labels | Discovering hidden patterns | Cluster groups | Interpretation requires context |
| Scenario analysis | Tests defined “what if” conditions | Planning for change | Scenario comparison | Only as good as assumptions |
| Sensitivity analysis | Tests impact of variable changes | Identifying key drivers | Sensitivity tables | Simplifies complex interactions |
| Monte Carlo simulation | Runs many randomized scenarios | Estimating outcome ranges | Probability distributions | Computationally intensive, assumption dependent |
| Threshold analysis | Sets alert boundaries | Early warning systems | Threshold breach alerts | Thresholds require calibration |
| Control charts | Tracks process stability | Operational monitoring | Control limit charts | Best for stable, repeatable processes |
| Root cause analysis | Investigates underlying drivers | Post incident review | Cause findings | Requires sufficient detail in data |
| Network analysis | Maps relationships between entities | Vendor/fraud network mapping | Relationship maps | Requires linked data |
How Key Risk Indicators Support Earlier Action
KPI vs. KRI vs. Control Indicator: A KPI measures performance toward a goal. A KRI measures change in exposure to a specific risk. A control indicator measures whether a specific safeguard is functioning. A lagging indicator reflects what already happened; a leading indicator signals conditions that may lead to future issues.
| Function | Illustrative KRI |
|---|---|
| Finance | Days sales outstanding trend |
| Operations | Unplanned downtime hours per period |
| Customer service | Complaint escalation rate |
| Vendor management | Percentage of spend with top vendor |
| Supply chain | Average supplier lead time variance |
| Credit | Delinquency rate by segment |
| Fraud monitoring | Volume of flagged transactions pending review |
| Compliance | Number of overdue control remediation items |
| Technology operations | System incident frequency |
Thresholds must reflect your business context, historical performance, risk appetite, data quality, and management judgment, not a generic industry number.
What an Executive Risk Dashboard May Include
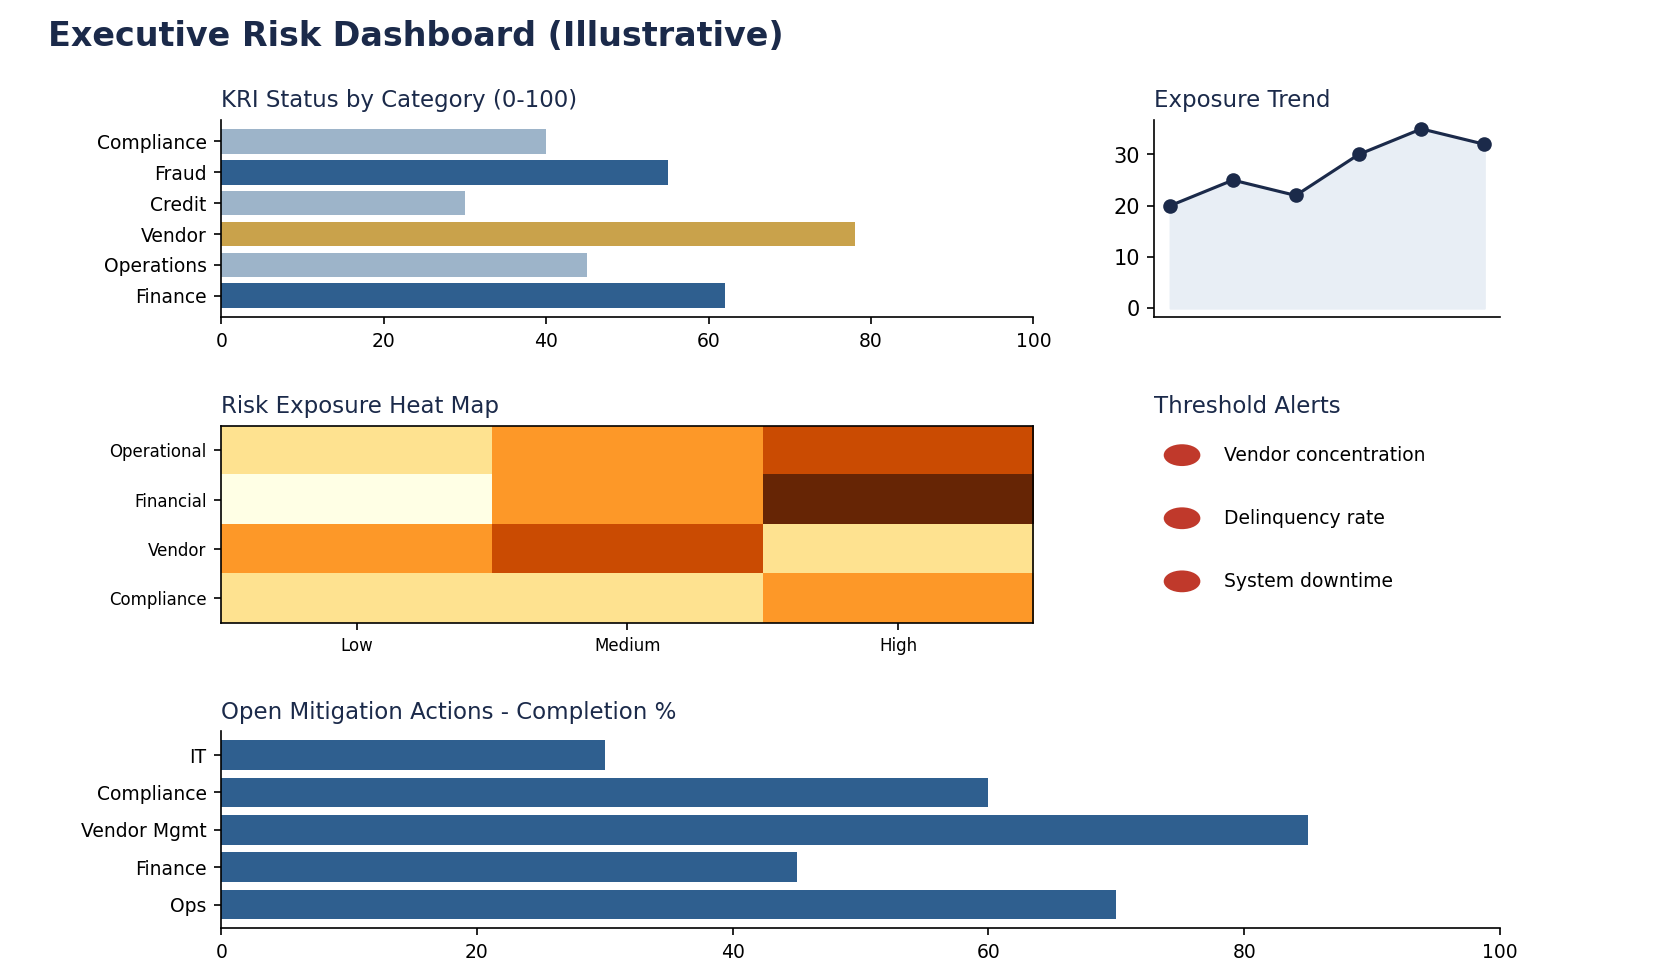
Top enterprise risks, exposure by category, KRI status, threshold breaches, risk trends, incident frequency, estimated impact, vendor concentration, operational exceptions, control effectiveness indicators, model monitoring metrics, open mitigation actions, risk owners, escalation status, scenario results, and geographic or departmental concentration.
Dashboards may be built in Power BI, Tableau, Excel, SQL based reporting, Python, or cloud analytics platforms depending on your existing environment. The goal is always the risk decision the dashboard supports, not the visualization itself. For enterprise wide reporting programs beyond risk, see data analysis services.
AI and Machine Learning in Risk Analytics
Machine learning is one method among many used within a broader risk analytics engagement, never the entire service. Practical applications include anomaly detection, pattern recognition, classification, risk scoring, forecasting of risk specific outcomes, document classification, transaction monitoring, early warning indicators, model monitoring, and automated risk summaries for human reviewers.
| Capability | Potential Use | Business Benefit | Main Limitation | Human Control |
|---|---|---|---|---|
| Anomaly detection | Flag unusual transactions | Faster exception identification | False positives/negatives | Analyst review required |
| Classification | Categorize risk events | Consistent triage | Bias risk in training data | Periodic bias assessment |
| Risk scoring | Rank exposure | Prioritized attention | Scores are estimates, not certainties | Score explanation required |
| Forecasting | Estimate likely risk trends | Earlier planning | Assumes pattern stability | Regular recalibration |
| Automated summaries | Condense risk reports | Time savings for leadership | May omit nuance | Human sign off before distribution |
The NIST AI Risk Management Framework is a voluntary resource intended to help organizations incorporate trustworthiness considerations, including explainability and bias review, into the design, development, and use of AI systems. AI generated risk signals should support, not automatically replace, qualified human decisions in high impact contexts.
Industry Use Cases
Banking and Financial Services. The central question is usually where credit or operational exposure is concentrated. Loan performance and transaction data feed segmentation models and probability estimates, producing a portfolio risk dashboard that ranks exposure by segment.
Insurance. Claims teams often want to know which patterns suggest emerging exposure before it shows up in loss ratios. Working from claims history and policy data, anomaly detection and trend analysis produce a claims risk indicator set that flags unusual clusters for review.
Healthcare Administration. Administrators typically need visibility into where operational and compliance exceptions are concentrated across departments. Scheduling, billing, and incident logs support control charts and exception detection, resulting in a compliance monitoring dashboard built around existing workflows.
Retail. A common question is which stores or SKUs carry the highest loss risk. Sales, inventory, and shrinkage records are segmented and compared against thresholds to produce a loss risk heat map that ranks locations and product lines.
E-commerce. The priority is usually identifying which transactions warrant fraud review without slowing down legitimate orders. Order and payment data run through anomaly and network analysis, producing a fraud exception queue for human investigators.
Manufacturing. Operations leaders want to know which production lines carry rising failure risk before it disrupts output. Downtime, defect, and maintenance logs support trend and root cause analysis, resulting in an operational risk dashboard that ranks lines by exposure.
Logistics. Where are delivery delays concentrated, and why? Route, carrier, and timing data are segmented and tested for sensitivity to specific variables, producing delivery risk indicators tied to specific lanes or carriers.
Supply Chain. A recurring concern is dependency on a small number of suppliers. Supplier, contract, and delivery records support concentration analysis and scenario testing, producing a supplier risk scenario model that shows exposure under different disruption conditions.
SaaS and Technology. Growth teams often need to see where revenue and renewal risk is building before it shows up in churn numbers. Billing, usage, and support data are segmented and modeled probabilistically, producing a customer risk dashboard focused on renewal exposure.
Telecommunications. Network operations teams want early visibility into which segments show rising incident risk. Network logs and incident tickets support control chart and trend analysis, resulting in network risk indicators tracked by segment.
Real Estate. Property managers often ask which properties or tenants carry higher payment risk. Lease and payment history are segmented and modeled for delinquency, producing a tenant risk scorecard.
Professional Services. Firms frequently want to know which engagements carry margin or delivery risk before they become write offs. Project timelines and cost data are reviewed through variance and trend analysis, resulting in a project risk dashboard.
Education. Institutions often need to see where enrollment or compliance risks are concentrated across programs. Enrollment, funding, and compliance records support trend and threshold analysis, producing an institutional risk report for leadership review.
Nonprofits. A common question is where funding or grant compliance risk is building across programs. Grant, funding, and program records support trend analysis and exception detection, resulting in a grant risk dashboard.
Energy and Utilities. Asset managers want to know which assets carry higher failure or safety risk as equipment ages. Maintenance, sensor, and incident logs support control charts and predictive modeling, producing an asset risk monitoring report.
Illustrative Scenarios
The following are illustrative examples used to explain our approach. They are not descriptions of actual client engagements or guaranteed results.
Scenario: Manufacturing Operational Risk Business question: Which production lines show rising downtime, defect rates, and supplier dependency? Data required: Maintenance logs, defect records, supplier delivery data. Analytical approach: Trend analysis, root cause analysis, supplier concentration review. Potential output: Operational risk dashboard ranking lines by exposure. Illustrative KRIs: Unplanned downtime hours, defect rate trend, single supplier dependency percentage. Limitations: Requires consistent maintenance logging; correlation does not confirm a single root cause.
Scenario: SaaS Customer and Revenue Risk Business question: Where is churn and revenue concentration risk building? Data required: Billing history, usage data, support tickets, renewal dates. Analytical approach: Segmentation, probability modeling of churn related risk, concentration analysis. Potential output: Customer risk dashboard with renewal exposure view. Illustrative KRIs: Failed payment rate, support escalation rate, revenue concentration by top accounts. Limitations: Model estimates are probabilistic, not guarantees of customer behavior.
Scenario: Vendor Risk Business question: How exposed is the business to a small number of key vendors? Data required: Contract terms, delivery performance, incident logs, cost data. Analytical approach: Concentration analysis, delivery variability review, scenario testing. Potential output: Vendor risk dashboard with dependency scoring. Illustrative KRIs: Percentage of spend with top vendor, on time delivery rate, incident frequency. Limitations: Findings depend on the completeness of vendor performance records.
What You May Receive
| Deliverable | Typical Use |
|---|---|
| Risk analytics readiness assessment | Baseline understanding of data and gaps |
| Risk data inventory | Catalogue of usable risk data sources |
| Risk measurement framework | Shared definitions, scales, thresholds |
| Risk taxonomy recommendations | Consistent risk categorization |
| KRI catalogue and definition sheets | Documented, monitorable indicators |
| Risk scoring methodology and model | Transparent exposure ranking |
| Scenario and sensitivity analysis models | Tested assumptions and outcome ranges |
| Stress testing framework | General business resilience testing |
| Anomaly detection prototype | Exception flagging for review |
| Early warning indicator model | Leading indicator monitoring |
| Risk heat map | Visual exposure summary |
| Executive, operational, and vendor risk dashboards | Ongoing monitoring tools |
| Risk monitoring and model performance reports | Tracking indicator and model health |
| Threshold and escalation framework | Defined response triggers |
| Risk analytics roadmap | Prioritized next steps |
| Technical documentation and executive summary | Internal reference and leadership briefing |
| Training and handover session | Internal team enablement |
Deliverables depend on the agreed scope of your engagement.
Discuss Your Risk Reporting Needs →
Metrics for Evaluating Risk Analytics
Success should never be judged by model accuracy alone. Relevant metrics include data coverage, data completeness, reporting timeliness, KRI adoption, threshold breach detection rate, false positive rate, false negative rate, precision, recall, calibration, model stability, drift, alert to investigation rate, incident detection time, risk report preparation time, percentage of risks with assigned owners, mitigation action completion rate, forecast error (where applicable), stakeholder usage, and decision turnaround time.
Which metrics matter most depends on the engagement type. A KRI project is measured differently than a predictive fraud detection prototype.
How Much Does Risk Analytics Consulting Cost?
There is no universal price for risk analytics consulting. Cost depends on the number of risk areas covered, number and quality of data sources, historical data availability, regulatory complexity, model complexity, dashboard requirements, real time integration needs, documentation requirements, stakeholder workshops, validation requirements, deployment needs, training, and ongoing monitoring.
Common engagement structures include:
- Risk analytics assessment
- KRI development project
- Risk dashboard project
- Scenario modeling project
- Predictive risk model
- Fraud or anomaly detection prototype
- Ongoing risk reporting support
- Enterprise risk analytics engagement
Outsourced Consulting vs. Internal Team
| Factor | Internal Team | External Consultant | Hybrid |
|---|---|---|---|
| Setup time | Slower to build capability | Faster deployment | Moderate |
| Specialized expertise | Limited to existing staff | Broad cross industry methods | Combines both |
| Technology | Depends on existing tools | Flexible platform selection | Shared |
| Data access | Deep internal knowledge | Requires onboarding | Best of both |
| Independence | Less independent view | More objective assessment | Balanced |
| Scalability | Constrained by headcount | Scales with project scope | Flexible |
| Ongoing ownership | Strong long term ownership | Requires handover plan | Shared ownership |
| Cost structure | Fixed salary cost | Project based cost | Mixed |
| Best use case | Steady state monitoring | Strategy, modeling, dashboard build | Build with consultant, run internally |
Ethics, Privacy, and Responsible Use
Every engagement is grounded in authorized data access, data minimization, confidentiality, secure handling, and purpose limitation. We support explainability, bias assessment, human review, appropriate documentation, audit trails, role based access, and retention discipline throughout the work.
Model limitations are documented, not hidden. Risk decisions that significantly affect individuals, such as credit, employment, or claims decisions, may require legal, compliance, ethical, and domain expert review beyond this analytics engagement. This page does not constitute legal advice.
Why Choose Data Science Consulting Pro
- Business first problem definition before any modeling begins
- Data science and analytics expertise applied specifically to risk questions
- Custom risk measures built around your operations, not generic templates
- Explainable methods so stakeholders understand how scores and models work
- Clear reporting designed for executive and risk owner audiences
- Model and dashboard support that continues after initial delivery
- Human reviewed recommendations. Outputs are never delivered without review
- Practical documentation that your team can maintain
- Flexible project scopes from a single assessment to a full engagement
- Confidential handling of all data and findings
We do not claim regulatory approval, audit authority, guaranteed compliance, guaranteed risk reduction, guaranteed fraud detection, or experience with named institutions unless independently verifiable.
Related services: Predictive Analytics | Machine Learning Services | AI Strategy Consulting | Data Governance Consulting
Risk Analytics, Predictive Analytics, and Data Governance: What Is the Difference?
| Service | Main Question | Typical Output |
|---|---|---|
| Risk analytics consulting | What could go wrong, how exposed are we, and what should we monitor? | KRIs, risk scores, scenarios, alerts, risk reports |
| Predictive analytics | What is likely to happen next? | Forecasts and probability estimates |
| Data analysis | What happened and what patterns exist? | Findings, trends, comparisons |
| Data governance | How should organizational data be owned, controlled, and trusted? | Policies, roles, standards |
| Dashboard development | How should metrics be visualized and monitored? | Interactive dashboards |
Frequently Asked Questions
It is the use of data, statistics, modeling, and visualization to help organizations identify, measure, monitor, and respond to business uncertainty. It supports decisions but does not eliminate risk.
A consultant assesses your risk data, defines measurement frameworks, builds indicators and models, creates dashboards, and helps monitor risk over time, always working alongside your internal team’s judgment.
Common sources include financial records, transactions, operational logs, vendor data, incident records, and compliance exceptions. Data quality and availability determine what analysis is possible.
Risk management is the broader organizational discipline of governing risk. Risk analytics is the data driven component that measures, models, and monitors risk to support that discipline.
Predictive analytics forecasts outcomes across many business areas. Risk analytics applies prediction specifically to risk related events like default, disruption, or fraud, within a broader risk measurement framework.
KRIs are measurable signals that track change in a specific risk category over time, with thresholds that trigger management attention when exceeded.
It can surface early signals, such as unusual trends or exceptions, that may indicate emerging risk. It cannot guarantee that every emerging risk will be detected.
Yes. Dashboards are built to support specific risk decisions, using tools such as Power BI, Tableau, or custom SQL/Python based reporting.
Yes, for tasks like anomaly detection, classification, and forecasting. AI outputs are treated as decision support signals reviewed by qualified people, not automatic conclusions.
A structured method for ranking exposure based on factors like likelihood, impact, and control strength. Scores are relative decision support tools, not certainties.
Through testing against historical data, stakeholder review, and ongoing monitoring for accuracy and drift after deployment.
Financial services, insurance, healthcare, retail, manufacturing, logistics, technology, and many other sectors use risk analytics, adapted to their specific data and risk categories.
Cost depends on scope: number of risk areas, data sources, model complexity, and reporting requirements. A tailored proposal follows an initial discovery conversation.
Timelines vary from a few weeks for an assessment to several months for a full model and dashboard build, depending on data readiness and complexity.
Share your risk challenge and current data situation through our intake form. We review it, clarify scope, and provide a tailored proposal with timeline and deliverables.
Turn Risk Data Into Earlier, Clearer Decisions
Risk analytics consulting helps you move from scattered spreadsheets and after the fact reports to measurable indicators, tested scenarios, and dashboards that support better decisions, without promising to eliminate uncertainty.
Request a Risk Analytics Assessment or Discuss Your Risk Reporting Needs using the form below.
Every engagement is scoped to your organization, with confidential handling of your data throughout.
Proposal form fields: Name, Business email, Company, Industry, Main risk challenge, Risk categories involved, Current reporting approach, Available data sources, Desired output, Preferred timeline
Submission process:
- Describe the risk decision or reporting problem.
- Our team reviews available data and current process.
- We clarify scope, methods, deliverables, limitations, timeline, and price.
- You receive a tailored proposal.
Reviewed by the Data Science Consulting Pro analytics team. This page provides general information about risk analytics consulting and does not constitute legal, regulatory, audit, actuarial, or investment advice.
Learn more: Homepage | All Services | Data Analytics Tools | About Us | Contact Us | AI Workflow Automation | Revenue Forecasting Package