How to Analyze Sales Data: A Practical Guide for Better Business Decisions
Sales data is one of the most valuable assets in any business. It shows what customers buy, which products generate revenue, which sales channels perform best, and where performance is slowing down. However, many businesses collect sales data every day without using it properly. They may have spreadsheets, CRM reports, invoices, e-commerce records, accounting exports, or dashboard reports, but they still struggle to turn those numbers into clear business decisions.
Learning how to analyze sales data helps a business move from guesswork to evidence-based decision-making. Instead of relying only on opinions, managers can use sales trends, customer behavior, product performance, sales channels, and revenue patterns to decide what to improve, where to invest, and which opportunities to prioritize.
Sales data analysis is useful for small businesses, startups, e-commerce companies, SaaS teams, B2B companies, sales departments, and growing organizations that want clearer reporting. Whether a business uses Excel, Google Sheets, Power BI, a CRM system, or a custom dashboard, the goal is the same: turn raw sales records into insights that improve revenue, forecasting, customer retention, and business performance.
If your business needs help cleaning, organizing, and interpreting sales data, data analysis services can help turn scattered sales records into actionable reports and dashboards.
What Is Sales Data Analysis?
Sales data analysis is the process of collecting, cleaning, organizing, comparing, visualizing, and interpreting sales information to understand business performance. It helps businesses move beyond basic reporting and discover what is actually driving revenue, customer behavior, product demand, sales growth, and profitability.
A sales report may show what happened, but sales analysis explains why it happened and what action should follow. For example, a monthly sales report may show that revenue increased by 12%, but deeper analysis may reveal that the increase came from one large customer while regular customer orders declined. That insight changes the business decision because the company may need to strengthen customer retention instead of assuming overall sales health is improving.
Sales data analysis can answer practical questions such as which products generate the most revenue, which customers buy most often, which sales channels perform best, which months are strongest or weakest, which regions are growing, which sales representatives need support, and which customers may stop buying. When done well, it turns raw sales records into practical business intelligence.
Why Sales Data Analysis Matters for Business Growth
Sales data analysis matters because it helps businesses make better decisions with evidence. Without analysis, a business may know how much it sold but not why sales changed, which products are most profitable, which customers deserve priority, or which channels are wasting money.
A business can use sales data analysis to identify best-selling products, improve sales forecasting, understand customer buying behavior, compare sales channels, track team performance, detect revenue decline early, and improve pricing or discount strategies. It can also support better inventory planning, marketing decisions, customer retention, and management reporting.
For example, a business may see that total revenue is increasing, but profit is falling. A deeper sales analysis may show that most revenue growth is coming from discounted products with low margins. Without that insight, the business may continue celebrating sales growth while profitability gets weaker.
Sales analytics also supports stronger reporting systems. Tools such as Microsoft Power BI help businesses build interactive reports and dashboards that make data easier to explore, visualize, and share across teams.
Types of Sales Data You Should Collect
Before analyzing sales data, a business needs to know what information to collect. Good analysis depends on relevant, accurate, and well-structured data. Collecting more data is not always better. The most useful sales data is the data that answers real business questions.
| Sales Data Type | Examples | Why It Matters |
|---|---|---|
| Transaction data | Order ID, invoice number, date, quantity | Shows what was sold and when |
| Customer data | Customer name, segment, location, industry | Helps analyze buying behavior |
| Product data | Product name, category, SKU, service type | Shows product or service performance |
| Revenue data | Gross sales, net sales, discounts, taxes | Tracks business income |
| Profit data | Cost, margin, profit per product | Helps avoid revenue-only decisions |
| Sales channel data | Website, store, distributor, marketplace, sales rep | Shows where sales come from |
| Time-based data | Day, week, month, quarter, year | Helps identify trends and seasonality |
| Salesperson data | Rep name, team, territory, target | Tracks sales team performance |
| Returns and refunds | Returned items, refund value, reason | Shows product or service issues |
| Lead data | Source, conversion status, pipeline stage | Connects marketing and sales performance |
A business that only tracks revenue may miss important patterns. A business that tracks revenue, customers, products, channels, margins, and time periods can understand performance more clearly and make better decisions.
Step 1: Define the Business Question
Every sales analysis should begin with a clear business question. Without a question, the analysis can become unfocused. A company may create many charts and tables, but those visuals may not help managers make a decision.
Useful sales analysis questions include: Why did sales decline last month? Which products are driving most revenue? What customer groups should we prioritize? Which sales channel has the highest return? Are discounts increasing revenue or reducing profit? Is one region underperforming compared with others? What revenue should we expect next quarter?
The question determines the data you need, the metrics you should calculate, and the best way to present the findings. For example, if the question is about monthly performance, the business needs time-based sales data. If the question is about customer retention, the analysis should focus on repeat purchases, customer history, churn risk, and customer lifetime value.
Step 2: Gather Sales Data from the Right Sources
Sales data often comes from different systems. A business may have customer information in a CRM, transactions in accounting software, website orders in an e-commerce platform, and manual updates in Excel. This makes analysis difficult because no single system gives the full picture.
Common sales data sources include CRM systems, point-of-sale systems, e-commerce platforms, accounting software, Excel spreadsheets, Google Sheets, ERP systems, website analytics tools, marketing platforms, customer databases, and sales team reports.
The first goal is to bring the right data together. For small businesses, this may mean combining Excel files. For growing companies, it may require automated reporting, data integration, or business intelligence dashboards. If your sales data is scattered across different tools, business intelligence services can help connect, organize, and report your data in one clear view.
Step 3: Clean and Prepare the Sales Data
Sales data must be cleaned before analysis. Dirty data leads to wrong conclusions. For example, if the same customer appears under different names, customer sales analysis will be inaccurate. If cancelled orders are mixed with completed orders, revenue may look higher than it actually is.
Common sales data problems include duplicate customer records, missing values, wrong product names, inconsistent date formats, different currency formats, incorrect quantities, cancelled orders mixed with completed orders, returns not separated from sales, inconsistent sales representative names, and unstandardized regions or product categories.
| Cleaning Task | Why It Matters |
|---|---|
| Remove duplicate records | Prevents double counting |
| Standardize date formats | Supports trend analysis |
| Check missing values | Reduces reporting gaps |
| Separate cancelled orders | Improves revenue accuracy |
| Separate returns and refunds | Shows true net sales |
| Standardize product names | Improves product analysis |
| Standardize customer names | Improves customer analysis |
| Validate totals | Confirms accuracy against source systems |
| Create clear categories | Makes dashboards easier to use |
Poor data quality affects every part of sales reporting. A clean dataset gives managers more confidence in the numbers and makes dashboards more reliable. If your business struggles with duplicate, incomplete, or inconsistent records, data cleaning services can help prepare your sales data for accurate reporting.
Step 4: Choose the Right Sales Metrics and KPIs
Sales data becomes useful when it is connected to the right metrics. A key performance indicator, or KPI, helps measure whether sales performance is improving, declining, or meeting expectations. The right KPI depends on the type of business and the decision being made.
| Sales KPI | What It Measures | Why It Matters |
|---|---|---|
| Total revenue | Total sales value | Shows overall sales performance |
| Sales growth rate | Change in sales over time | Shows whether revenue is increasing |
| Average order value | Average value per order | Helps improve pricing and bundling |
| Number of orders | Total completed orders | Shows sales activity |
| Units sold | Quantity sold | Helps with inventory planning |
| Gross profit margin | Profit after cost of goods | Shows sales profitability |
| Conversion rate | Leads or visitors converted to customers | Measures sales effectiveness |
| Repeat purchase rate | Customers buying again | Shows retention strength |
| Customer lifetime value | Revenue expected from a customer | Helps prioritize customer segments |
| Sales by product | Revenue per product | Shows best and worst performers |
| Sales by region | Revenue by location | Helps compare markets |
| Sales by channel | Revenue by source | Shows strongest sales channels |
| Return rate | Returned sales percentage | Indicates quality or expectation issues |
| Sales per representative | Revenue by salesperson | Tracks team performance |
Not every business needs every KPI. A retail business may focus on product sales, average order value, and repeat purchases. A B2B company may focus on pipeline value, conversion rate, sales cycle length, and customer lifetime value. A SaaS company may focus on monthly recurring revenue, churn, upgrades, and customer retention.
Practical Example: How to Analyze Monthly Sales Data
A practical example makes sales data analysis easier to understand. Assume a small business reviews three months of sales data.
| Month | Revenue | Orders | Average Order Value | Returns | Profit Margin |
|---|---|---|---|---|---|
| January | $42,000 | 420 | $100 | $2,100 | 32% |
| February | $48,000 | 500 | $96 | $3,800 | 28% |
| March | $53,000 | 610 | $87 | $6,200 | 22% |
At first glance, the business may think performance is improving because revenue increased from $42,000 to $53,000. However, deeper analysis shows that average order value decreased, returns increased, and profit margin dropped from 32% to 22%. This means the business is selling more, but each sale is becoming less profitable.
The correct decision is not simply to celebrate revenue growth. The business should investigate why returns increased, whether discounts reduced average order value, whether low-margin products drove March sales, and whether product quality or customer expectations changed. This is why sales analysis must go beyond total revenue. The goal is to understand the full business story behind the numbers.
Step 5: Analyze Sales Trends Over Time
Trend analysis helps a business understand how sales change across days, weeks, months, quarters, and years. This is one of the most important parts of sales data analysis because it shows whether performance is improving, declining, or following a seasonal pattern.
A business can analyze monthly revenue trends, weekly sales patterns, seasonal changes, year-over-year growth, month-over-month performance, product demand changes, and campaign-related sales increases. These patterns help managers understand whether a change is temporary, seasonal, or part of a larger performance issue.
For example, an e-commerce business may discover that sales increase every November and December but fall sharply in January. That insight can help the business plan inventory, advertising, staffing, and cash flow earlier. Line charts are useful for sales trend analysis because they show movement over time, while bar charts help compare monthly or quarterly sales.
Step 6: Analyze Sales by Product or Service
Product-level sales analysis shows which products or services drive business performance. It helps identify strong products, weak products, high-return items, and opportunities for bundling or cross-selling.
When analyzing product sales, look at best-selling products, low-performing products, high-revenue products, high-profit products, low-margin products, products with frequent returns, products with seasonal demand, and products often bought together.
Revenue alone can be misleading. A product may generate high sales but produce low profit because of discounts, high costs, or frequent returns. Another product may sell fewer units but produce stronger margins. A good product sales analysis should compare revenue, quantity sold, profit margin, return rate, and customer demand.
Step 7: Analyze Sales by Customer Segment
Customer analysis helps a business understand who buys, how often they buy, and which customer groups generate the most value. This is important because not all customers contribute equally to business growth.
A business can analyze customers by total revenue, repeat purchases, average order value, buying frequency, customer lifetime value, product preferences, location, industry, customer type, churn risk, and dormant accounts.
For example, a company may discover that a small group of customers generates most revenue. It may also discover that many customers buy once and never return. These insights can improve retention campaigns, loyalty offers, account management, customer targeting, and personalized offers.
Step 8: Analyze Sales by Channel
Sales channel analysis shows where revenue comes from. A business may sell through its website, physical store, social media, marketplace, distributors, sales representatives, email campaigns, or paid ads.
When comparing sales channels, look at revenue, number of orders, profit margin, conversion rate, customer acquisition cost, repeat purchase rate, average order value, and refund rate. The channel with the highest revenue is not always the best channel. For example, paid ads may generate many sales but have high acquisition costs. Organic search may generate fewer sales but stronger profit.
Channel analysis helps businesses allocate budgets wisely and focus on the most profitable sales sources.
Step 9: Analyze Sales Team or Regional Performance
Sales managers can use sales data to evaluate team and regional performance more fairly. However, revenue alone should not be the only measure because some sales representatives may handle difficult territories, low-quality leads, or longer sales cycles.
Useful performance metrics include revenue by representative, revenue by region, number of closed deals, average deal size, lead conversion rate, sales cycle length, target achievement, follow-up activity, lost opportunities, and pipeline value.
Regional analysis can reveal whether a location needs more marketing, better pricing, different products, or stronger sales support. Sales team analysis can show who needs training, which methods work best, and where management should intervene.
Step 10: Visualize Sales Data with Dashboards
Dashboards make sales data easier to understand. Instead of reading long spreadsheets, managers can see KPIs, trends, comparisons, and alerts in one place. A good dashboard helps users answer business questions quickly.
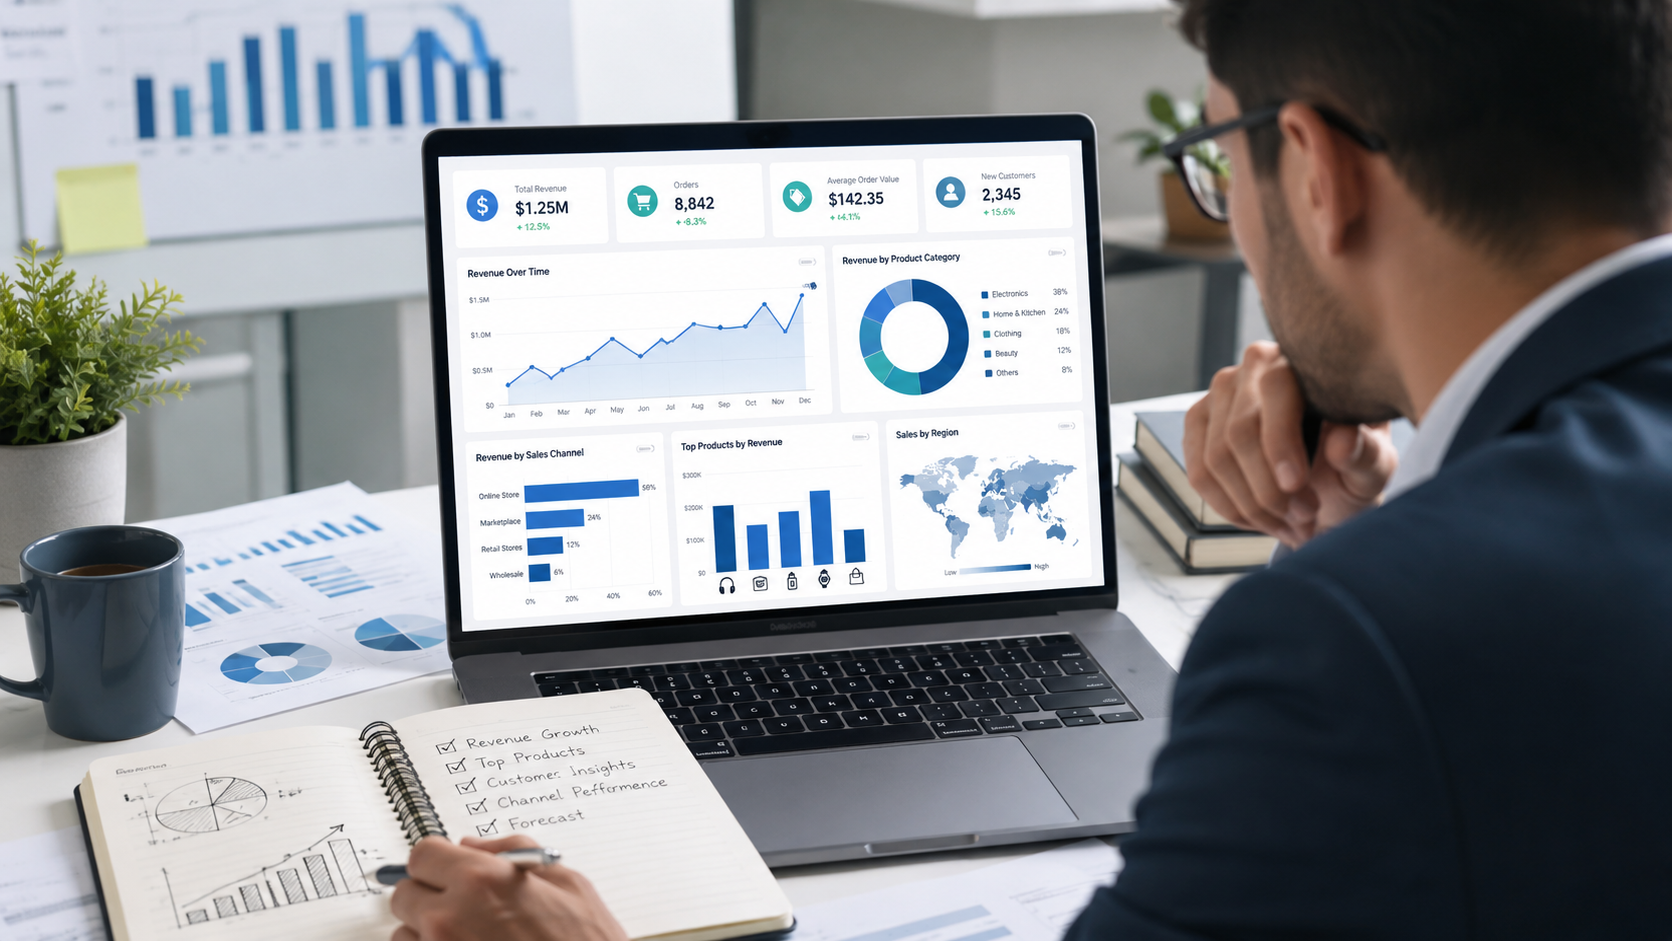
Useful sales dashboard visuals include KPI cards for revenue, orders, profit, and growth; line charts for sales trends; bar charts for product comparisons; funnel charts for leads and conversions; maps for regional sales; tables for detailed breakdowns; and filters by date, product, customer, region, and channel.
A good sales dashboard should be simple, focused, and decision-oriented. It should not include too many charts. Every visual should answer a business question. Google Looker Studio is one example of a reporting tool businesses use to create shareable visual reports and dashboards.
For businesses that need custom dashboards, dashboard development services can help create clear reporting systems for sales, finance, marketing, operations, and management.
Mid-Article CTA: Need Clearer Sales Reports?
If your sales reports take too long to prepare, contain inconsistent numbers, or fail to explain what is driving revenue, DataScienceConsultingPro.com can help. Our team can clean your sales data, organize your KPIs, build dashboards, and turn raw sales records into decision-ready insights.
Request a quote for sales data analysis, dashboard development, Power BI reporting, Excel automation, or business intelligence support.
Step 11: How to Analyze Sales Data in Excel
Excel is one of the most common tools for analyzing sales data, especially for small businesses and teams that work with spreadsheets. It is useful for quick analysis, manual reporting, pivot tables, charts, and summary reports.
You can use Excel to sort and filter sales records, create pivot tables, summarize revenue by product, analyze monthly sales trends, compare sales representatives, calculate growth rates, build basic charts, track customer purchases, and create simple sales forecasts.
Excel works well when the dataset is manageable and reporting does not require constant automation. However, Excel can become limited when the business needs real-time dashboards, multiple data sources, large datasets, or automated reports. If your business still relies heavily on manual spreadsheets, Excel dashboard and reporting services can help automate reports and improve spreadsheet-based decision-making.
Step 12: How to Analyze Sales Data in Power BI
Power BI is useful when a business needs interactive dashboards, automated reporting, and data from multiple sources. It can connect to Excel files, databases, CRM systems, cloud platforms, and other business tools.
Power BI can help sales teams create interactive sales dashboards, track revenue by product, region, and channel, monitor sales KPIs, filter reports by date or category, automate recurring sales reports, share dashboards with managers, compare current and previous periods, and visualize customer and product performance.
Microsoft provides a Power BI sales and marketing sample that shows how business data can be explored through reports and dashboards. For growing businesses, Power BI dashboard services can help transform raw sales records into interactive dashboards for management reporting.
Step 13: Use Sales Forecasting to Plan Ahead
Sales analysis should not only explain the past. It should also help businesses plan for the future. Sales forecasting uses historical sales data, trends, seasonality, and business context to estimate future revenue or demand.
Sales forecasting can support revenue planning, inventory planning, cash flow management, staffing decisions, marketing budget planning, production planning, sales target setting, and business expansion decisions.
For example, if a business knows that sales usually increase in the last quarter of the year, it can prepare stock, staff, marketing campaigns, and cash flow earlier. If forecasting shows demand may decline, management can adjust pricing, promotions, or sales strategy before revenue drops.
For advanced forecasting, businesses can use statistical models, machine learning, or predictive analytics. Predictive analytics services can help businesses move from simple reporting to forward-looking insights.
Step 14: Turn Sales Insights into Business Decisions
Sales analysis is valuable only when it leads to action. A dashboard or report should not just display numbers. It should help managers decide what to do next.
| Sales Insight | Possible Business Decision |
|---|---|
| Sales are high but profit is low | Review pricing, discounts, or product mix |
| One product is declining | Improve marketing, replace it, or reduce stock |
| A channel has high revenue but low profit | Review acquisition cost or pricing |
| Repeat purchases are falling | Improve retention campaigns |
| A region is underperforming | Investigate local demand or sales support |
| Forecast shows seasonal demand | Plan stock and staffing earlier |
| Returns are increasing | Review product quality or customer expectations |
| A salesperson has low conversion | Provide training or improve lead quality |
The best sales analysis connects every insight to a business decision. That is what separates useful analytics from ordinary reporting.
Common Mistakes Businesses Make When Analyzing Sales Data
Many businesses collect sales data but still make poor decisions because they analyze it incorrectly. One common mistake is looking only at total revenue. Revenue is important, but it does not show profit, customer quality, returns, discounts, or long-term customer value.
Another mistake is using dirty data. Duplicate records, missing values, wrong categories, and inconsistent customer names can produce misleading results. Businesses also make errors when they mix cancelled orders with completed sales, compare unequal time periods, track too many KPIs, or create cluttered dashboards that make decisions harder instead of easier.
A good sales analysis should explain what the numbers mean. Reporting figures without interpretation does not help managers act. The goal is not just to produce a report but to use the report to improve pricing, marketing, sales strategy, customer retention, forecasting, and business planning.
Best Tools for Sales Data Analysis
The best tool depends on the size of the business, the complexity of the data, and the level of automation required. Small businesses may start with Excel or Google Sheets, while growing companies may need Power BI, Tableau, Looker Studio, CRM dashboards, SQL databases, or advanced analytics tools.
| Tool | Best For |
|---|---|
| Excel | Small datasets, simple reports, pivot tables |
| Google Sheets | Collaborative spreadsheet analysis |
| Power BI | Interactive dashboards and automated reporting |
| Tableau | Advanced visual analytics |
| Looker Studio | Shareable web-based reports |
| CRM dashboards | Pipeline and sales team reporting |
| SQL databases | Structured data storage and querying |
| Python or R | Advanced analytics and forecasting |
| BI platforms | Enterprise reporting and decision support |
HubSpot sales reporting software is one example of a platform used for tracking sales reports, forecasts, activities, and performance. Salesforce also provides guidance on sales reporting for tracking performance, identifying trends, and supporting business decisions.
When Should You Hire a Sales Data Analyst or Consultant?
A business should consider expert support when sales reporting becomes too manual, confusing, or unreliable. This often happens when sales data is scattered across many systems, reports take too long to prepare, managers do not trust the numbers, or Excel files become too large and messy.
A sales data analyst or consultant can help when dashboards are outdated, forecasting is inaccurate, sales performance is changing without a clear reason, or the business needs automated reporting. Expert support is also useful when a company wants predictive sales insights, better KPI tracking, or a cleaner reporting process.
A consultant can help clean the data, build dashboards, identify key metrics, automate reporting, and turn sales information into practical recommendations.
How DataScienceConsultingPro.com Can Help
DataScienceConsultingPro.com helps businesses turn raw sales data into clear insights, dashboards, and decisions. Whether your sales data is stored in Excel, Google Sheets, CRM systems, accounting software, e-commerce platforms, or multiple disconnected tools, the right analytics support can help you understand what is happening and what to do next.
We can help with sales data cleaning, sales data analysis, sales dashboard development, Power BI dashboards, Excel reporting automation, business intelligence reporting, sales forecasting, customer sales analysis, product performance analysis, revenue trend analysis, KPI reporting, and management dashboards.
Need help turning your sales data into clear business insights? Request a quote from DataScienceConsultingPro.com and get a custom sales analytics solution for your business.
FAQs About How to Analyze Sales Data
The best way to analyze sales data is to begin with a clear business question, clean the data, choose relevant KPIs, compare trends over time, segment the data by product, customer, channel, or region, and then turn the findings into business decisions.
A business should analyze revenue, orders, products, customers, sales channels, regions, discounts, returns, profit margins, sales representatives, and time-based trends. The right data depends on the business model and decision being made.
Yes. Excel is useful for sorting sales records, creating pivot tables, building charts, calculating KPIs, and summarizing monthly sales. However, larger businesses may need automated dashboards or business intelligence tools when Excel becomes too manual.
To analyze monthly sales data, compare revenue, orders, average order value, profit margin, returns, and customer activity across each month. Look for patterns such as growth, decline, seasonality, unusual spikes, and changes in profitability.
To analyze product sales data, compare revenue, quantity sold, profit margin, return rate, discounts, and customer demand by product or service. This helps identify best sellers, weak products, high-margin items, and products that need pricing or marketing changes.
Common sales KPIs include total revenue, sales growth rate, average order value, gross profit margin, conversion rate, repeat purchase rate, customer lifetime value, sales by product, sales by channel, and return rate.
Dashboards help by showing sales KPIs, trends, product performance, customer segments, and channel performance in one visual report. They make it easier for managers to monitor performance and make faster decisions.
Sales reporting shows what happened, such as revenue, orders, and monthly performance. Sales analytics goes deeper by explaining why it happened, what patterns exist, and what action the business should take.
Sales data can be reviewed daily, weekly, monthly, quarterly, or annually depending on the business. Fast-moving businesses may need daily dashboards, while strategic decisions may require monthly or quarterly analysis.
A business should hire a sales data consultant when reports are manual, data is messy, dashboards are unclear, forecasts are unreliable, or managers need better insights for sales, revenue, customer, and product decisions.
Conclusion
Knowing how to analyze sales data helps businesses understand what drives revenue, which products perform best, which customers matter most, and which sales channels deserve more attention. It also helps managers detect problems earlier, improve forecasting, track KPIs, and make better decisions based on evidence rather than guesswork.
The process starts with a clear question, clean data, relevant metrics, trend analysis, segmentation, visualization, and action. Whether a business uses Excel, Power BI, Google Sheets, CRM reports, or custom dashboards, the goal is to turn sales numbers into decisions that improve business performance.
If your business needs clean sales reports, automated dashboards, or expert sales analytics support, contact DataScienceConsultingPro.com to request a custom quote.