Data warehouse vs database is an important comparison for any business that wants better reporting, cleaner dashboards, and more reliable analytics. Although both systems store data, they serve different purposes. A database helps a company run daily operations, while a data warehouse helps the company analyze performance, track trends, and make smarter decisions.
Many businesses collect data from websites, CRMs, accounting platforms, e-commerce systems, marketing tools, spreadsheets, and customer support platforms. However, the data often sits in separate systems. As a result, teams spend too much time exporting files, fixing spreadsheets, and trying to explain why reports do not match.
The difference between a database and a data warehouse matters because poor data structure leads to poor decisions. A business may have strong dashboard software, but the dashboard will still fail if the data behind it is messy, duplicated, or disconnected.
At DataScienceConsultingPro.com, we help businesses clean, organize, analyze, and report data through dashboards, business intelligence systems, data analysis, predictive analytics, and reporting automation. This guide explains the data warehouse vs database comparison in clear business language so you can choose the right system for your company.
Quick Answer: Data Warehouse vs Database
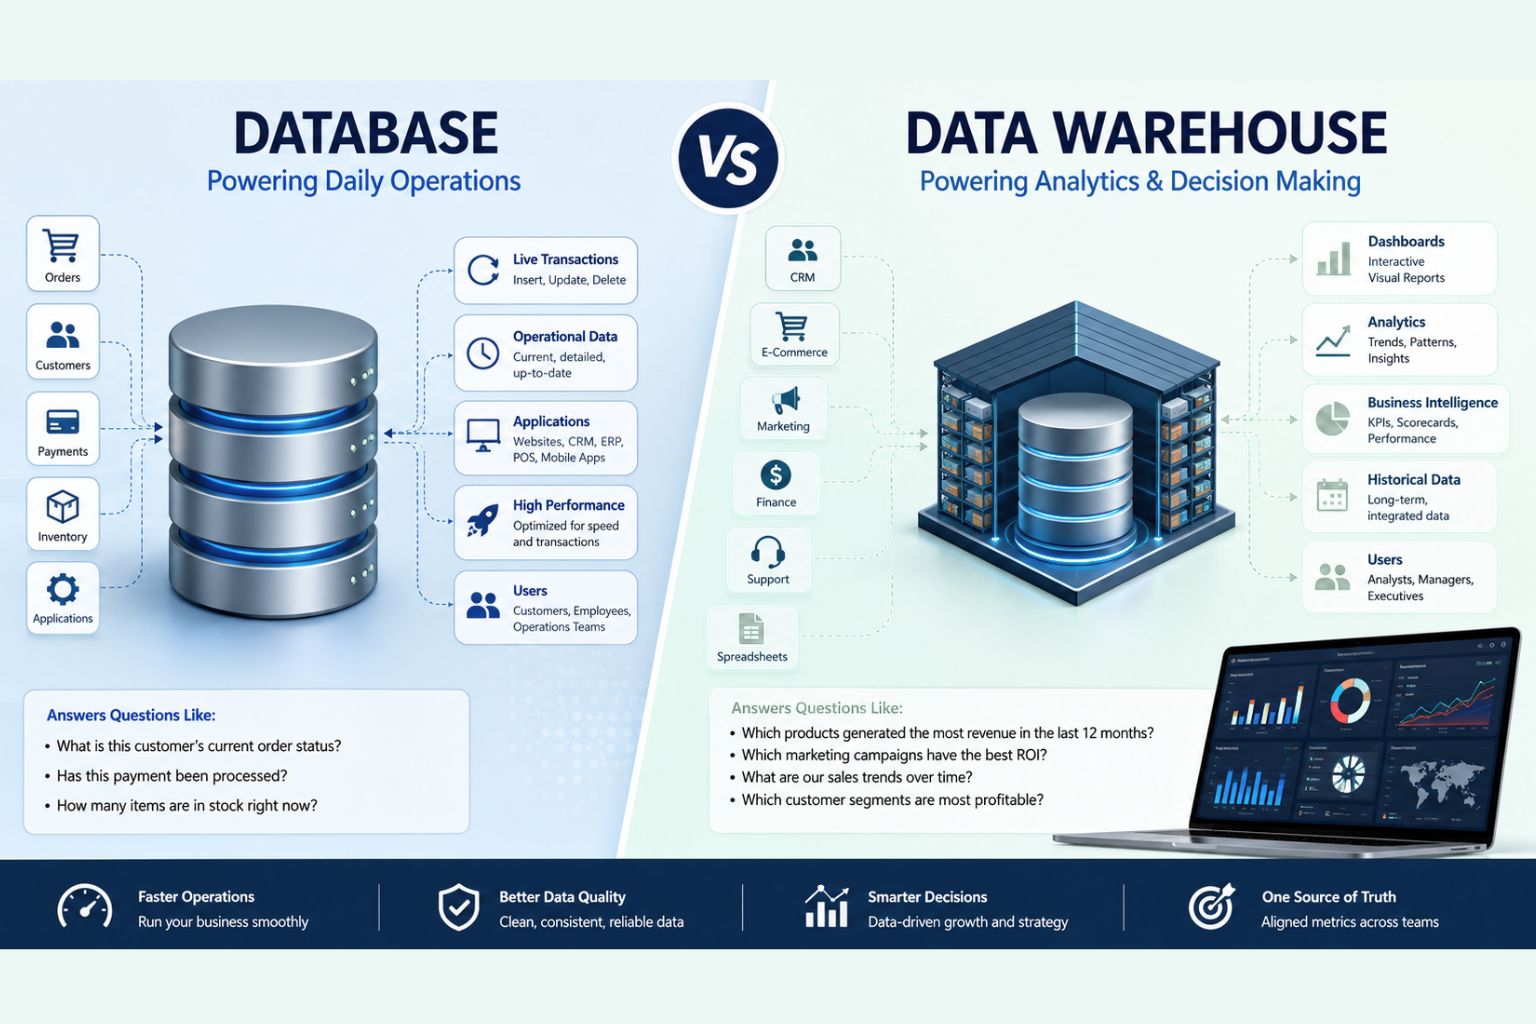
A database stores current operational data for daily transactions. A data warehouse stores integrated historical data for reporting, dashboards, business intelligence, and analytics.
In simple terms, a database helps your business operate. A data warehouse helps your business understand performance.
For example, a database can show whether a customer’s order has shipped. However, a data warehouse can show which products generated the most revenue over the last 12 months, which marketing channel produced the best customers, and which customer segment has the highest lifetime value.
Therefore, many growing businesses need both. The database keeps systems running, while the data warehouse gives leaders and analysts a trusted view of performance.
Who This Guide Is For
This guide is useful for business owners, founders, managers, analysts, finance teams, marketing teams, SaaS companies, e-commerce businesses, healthcare organizations, logistics companies, and operations teams.
It is especially useful if your business stores data in several platforms, such as a CRM, accounting software, website analytics platform, advertising account, e-commerce system, customer support tool, or spreadsheet folder.
You may also find this guide helpful if your company struggles with slow dashboards, inconsistent reports, manual Excel work, unclear KPIs, or different departments reporting different numbers.
What Is a Database?
A database is a structured system that stores, manages, updates, and retrieves data. Most business applications depend on databases because they need a reliable place to keep active records.
For example, when users log into a system, place an order, update a profile, make a payment, book an appointment, or check inventory, a database usually works behind the scenes.
Databases support daily operations. They handle current records quickly and accurately. Therefore, companies use them for websites, applications, CRMs, inventory systems, booking platforms, payment systems, HR software, customer portals, and internal tools.
A database usually stores information such as:
- Customer profiles
- Sales orders
- Invoices
- Payments
- User accounts
- Product catalogs
- Employee records
- Inventory records
- Booking details
- App activity
- Transaction history
For instance, an e-commerce website may use a database to store product details, customer information, cart activity, order status, payment confirmation, and delivery information. When a customer checks out, the database records the transaction. When the warehouse team updates shipping status, the database saves that update.
Common relational databases include MySQL, PostgreSQL, Microsoft SQL Server, and Oracle Database. These databases organize data into tables with relationships between them. In addition, some businesses use NoSQL databases such as MongoDB or Firebase when they need flexible structures for documents, mobile applications, real-time apps, or high-volume systems.
A database is essential when a business needs to run live operations. However, it is not always the best system for complex reporting, executive dashboards, historical trend analysis, or multi-source analytics.
What Is a Data Warehouse?
A data warehouse is a centralized system designed for analytics, reporting, dashboards, and business intelligence. Unlike an operational database, a data warehouse brings data together from multiple systems and organizes it for analysis.
A business may have customer data in a CRM, revenue data in accounting software, order data in an e-commerce platform, advertising data in Google Ads, website data in analytics tools, and support data in a helpdesk platform. Each system may work well on its own. However, leaders often need a complete view of the business.
A data warehouse solves this problem by combining data from different platforms into one structured reporting environment. It stores cleaned, historical, and integrated data so teams can answer bigger business questions.
For example, a data warehouse can help a company answer:
- How has revenue changed over time?
- Which products are most profitable?
- Which customer segments buy repeatedly?
- Which marketing campaigns produce the best return?
- Which departments need improvement?
- Which regions are growing fastest?
- Which KPIs are declining?
Popular cloud data warehouse platforms include Google BigQuery, Amazon Redshift, Snowflake, Azure Synapse Analytics, and Databricks SQL Warehouse. These platforms support large-scale analytics and modern business intelligence workflows.
If your business already collects data from many systems but struggles to create reliable reports, Data Cleaning Services and Business Intelligence Services can help prepare your data for better reporting.
Data Warehouse vs Database: Quick Comparison Table
| Feature | Database | Data Warehouse |
|---|---|---|
| Main purpose | Runs daily business operations | Supports analytics and reporting |
| Best used for | Transactions, live records, and applications | Dashboards, KPIs, BI, and trend analysis |
| Type of data | Current operational data | Historical and integrated data |
| Data sources | Usually one system or application | Multiple systems combined |
| Main users | Applications, customers, staff, and operations teams | Analysts, managers, executives, and BI teams |
| Query type | Inserts, updates, deletes, and lookups | Complex analytical queries |
| Performance focus | Fast transactions | Fast analysis across large datasets |
| Data structure | Optimized for operational efficiency | Optimized for reporting and analysis |
| Common workload | OLTP | OLAP |
| Reporting capability | Basic operational reporting | Advanced reporting and business intelligence |
| Dashboard suitability | Useful for simple live dashboards | Better for executive and analytical dashboards |
| Example tools | MySQL, PostgreSQL, SQL Server, Oracle | BigQuery, Snowflake, Redshift, Azure Synapse |
| Business value | Keeps systems running | Helps leaders make better decisions |
Main Difference Between Database and Data Warehouse
The main difference between a database and a data warehouse is purpose. A database helps a business operate, while a data warehouse helps a business analyze performance.
A database answers operational questions, such as:
- What is this customer’s current order status?
- Has this invoice been paid?
- How many units are currently in stock?
- Has this booking been confirmed?
- What is this user’s account status?
A data warehouse answers analytical questions, such as:
- Which products generated the most revenue last year?
- Which customer segments have the highest lifetime value?
- Which marketing campaigns produced the best return?
- Which locations are growing fastest?
- How has customer churn changed over six months?
This distinction matters because many businesses try to force operational systems to do analytical work. As data grows, that approach creates slow dashboards, incomplete reports, and inconsistent numbers.
A data warehouse creates a separate reporting environment. As a result, teams can analyze data without slowing down operational systems. They can also combine information from several platforms, define consistent KPIs, and build more reliable dashboards.
OLTP vs OLAP: The Technical Difference Made Simple
To fully understand data warehouse vs database, it helps to understand OLTP and OLAP. These terms explain the type of workload each system handles.
What Is OLTP?
OLTP means Online Transaction Processing. Operational databases use OLTP to handle daily transactions.
For example, OLTP supports activities such as creating orders, updating inventory, recording payments, adding customers, booking appointments, and changing account details.
OLTP systems must work quickly because they support live business activity. If an online store receives hundreds or thousands of orders, its database must process those transactions accurately and immediately.
What Is OLAP?
OLAP means Online Analytical Processing. Data warehouses use OLAP to analyze large volumes of historical data.
For example, OLAP supports revenue trend analysis, customer segmentation, profitability analysis, churn analysis, marketing ROI, product performance, and forecasting.
OLAP systems do not focus on updating individual records. Instead, they summarize, group, compare, and analyze large datasets. Therefore, they work well for dashboards, reports, and business intelligence.
| Area | OLTP | OLAP |
|---|---|---|
| Purpose | Daily transactions | Business analysis |
| Common system | Operational database | Data warehouse |
| Used by | Applications and operations teams | Analysts, managers, and executives |
| Data type | Current operational data | Historical and summarized data |
| Query style | Short and frequent queries | Complex analytical queries |
| Speed priority | Fast updates and lookups | Fast reporting and analysis |
| Example | Processing an order | Analyzing yearly revenue |
| Best use | Running operations | Understanding performance |
ETL and ELT: How Data Moves Into a Data Warehouse
A data warehouse becomes valuable when data from different systems moves into one reporting environment. This process usually happens through ETL or ELT.
ETL means Extract, Transform, Load. In this process, data is extracted from source systems, cleaned and transformed, then loaded into the data warehouse.
ELT means Extract, Load, Transform. In this process, data is extracted from source systems and loaded into the warehouse first. After that, the transformation happens inside the warehouse.
Both methods help businesses turn raw, scattered, and inconsistent data into reliable reporting data. Without proper ETL or ELT, a company may build attractive dashboards that still show inaccurate numbers.
Common ETL and ELT tasks include:
- Removing duplicate records
- Standardizing dates
- Cleaning customer names
- Matching IDs across systems
- Converting currencies
- Creating KPI fields
- Joining sales and marketing data
- Building reporting tables
- Fixing missing values
For example, one system may write dates as month-day-year, while another writes them as day-month-year. One platform may store customer names in uppercase, while another uses mixed case. If the business does not clean these differences, reports may become confusing.
This is why data cleaning is a critical part of business intelligence. If your data is messy, your dashboard will only make the mess easier to see. Services such as Data Cleaning Services, Data Analysis Services, and Business Intelligence Services can help turn raw data into a reliable reporting foundation.
Data Modeling in a Data Warehouse
A data warehouse is not just a place to dump data. To work well, the data must follow a clear model. Data modeling organizes information so reports, dashboards, and analysis become faster and easier to understand.
One common warehouse design is a star schema. A star schema uses a central fact table surrounded by dimension tables. For example, a sales fact table may store transaction values, quantities, discounts, and revenue. Dimension tables may describe customers, products, dates, regions, and sales channels.
Another approach is a snowflake schema. This design also uses fact and dimension tables, but it breaks some dimension tables into more detailed related tables.
A data mart is a smaller section of a data warehouse focused on a specific business area. For example, a company may build a sales data mart, finance data mart, marketing data mart, customer analytics data mart, or operations data mart.
Good data modeling helps teams trust reports. Without it, departments may define the same metric differently. For example, the sales team may define revenue based on orders placed, while the finance team may define revenue based on paid invoices. A strong warehouse model helps everyone report from the same logic.
Data Warehouse vs Database vs Data Lake
When comparing data warehouse vs database, many businesses also hear about a data lake. These three systems relate to data storage, but they do different jobs.
A database mainly stores current operational data. It supports applications, transactions, and live records.
A data warehouse stores cleaned, structured, and historical data. It supports reporting, dashboards, business intelligence, and analytics.
A data lake stores large amounts of raw data in different formats. This may include structured data, semi-structured data, logs, text files, images, clickstream data, IoT data, and machine-generated records.
A data lake can help with advanced analytics, machine learning, big data projects, and long-term storage. However, raw data does not automatically support good reporting. Teams still need cleaning, transformation, governance, and modeling before they can build reliable dashboards.
| System | Best For | Typical Data | Main Business Use |
|---|---|---|---|
| Database | Daily operations | Current structured data | Running applications and transactions |
| Data warehouse | Reporting and analytics | Cleaned historical data | Dashboards, KPIs, BI, and forecasting |
| Data lake | Large raw data storage | Raw structured and unstructured data | Advanced analytics, machine learning, and big data |
For most businesses, the first priority is not the most advanced platform. Instead, the priority is choosing the system that solves the reporting problem. A small business with messy spreadsheets may not need a complex data lake. It may first need data cleaning, a reporting model, and a practical dashboard system.
For larger datasets or complex analytics needs, Big Data Analytics Services can help create scalable analytics workflows.
Data Warehouse vs Database Examples by Industry
The data warehouse vs database comparison becomes clearer when you look at real business examples. Different industries use each system in different ways.
E-commerce Business
An e-commerce business uses a database to manage live store activity. The database stores customer accounts, product listings, orders, shopping carts, payment status, shipping details, inventory levels, and discount codes.
However, the same business may need a data warehouse to understand performance. The warehouse can combine sales data, marketing spend, website traffic, email campaign data, customer support data, and inventory data.
As a result, the company can analyze repeat purchases, abandoned carts, product profitability, customer lifetime value, seasonal trends, and marketing ROI. The database helps the store operate, while the data warehouse helps the business grow intelligently.
SaaS Company
A SaaS company uses a database to store users, subscriptions, invoices, login activity, feature usage, user roles, payment records, and account settings. This operational database keeps the software platform running.
However, the company needs a data warehouse to analyze churn, retention, monthly recurring revenue, product adoption, trial-to-paid conversion, expansion revenue, and feature usage trends.
These insights help the SaaS company improve pricing, reduce churn, identify high-value customers, and plan product development. Therefore, the database supports the product, while the warehouse supports strategy.
Healthcare Organization
A healthcare organization may use a database to store appointments, registration records, billing information, provider schedules, claims information, and operational records. These systems support daily administrative and service delivery processes.
A data warehouse can help healthcare leaders analyze patient flow, appointment trends, claims patterns, service demand, resource utilization, operational performance, and staffing needs.
However, healthcare data requires strong privacy controls, access permissions, and compliance processes. In this setting, the database supports operations, while the warehouse supports planning and performance improvement.
Finance or Accounting Team
A finance team may use a database to store invoices, payments, customers, vendors, payroll records, expenses, and account transactions. These records must stay accurate and current.
A data warehouse helps the finance team analyze revenue trends, cash flow, overdue payments, profitability, budget variance, customer payment behavior, and financial performance over time.
This makes it easier to prepare executive reports, monthly management accounts, and financial dashboards. Therefore, the warehouse helps finance teams move from manual spreadsheet work to a more reliable reporting process.
Logistics or Operations Business
A logistics company may use a database to store delivery routes, shipments, drivers, customer orders, inventory movement, vehicle records, and delivery status. This operational database keeps daily logistics activity organized.
A data warehouse helps the company analyze delivery delays, route efficiency, cost trends, fulfillment performance, inventory turnover, customer complaints, and operational bottlenecks.
These insights can help managers reduce costs, improve service quality, and support better planning.
When Should a Business Use a Database?
A business should use a database when it needs to store, update, and manage live operational records. If your company runs an application, website, customer portal, booking system, order platform, inventory system, or payment workflow, it needs a database.
A database works best when the business must process transactions quickly. This includes creating customer records, updating order status, recording payments, managing stock, saving user profiles, and retrieving account information.
For example, if a customer logs into your website and updates a delivery address, the database should save that change immediately. If a payment goes through, the database should record it accurately. If an item goes out of stock, the system should update the inventory count.
A database can support simple reports, such as today’s orders, open invoices, current inventory, or active users. However, it usually does not provide the best foundation for advanced analytics, long-term trend analysis, or dashboards that combine several systems.
When Should a Business Use a Data Warehouse?
A business should use a data warehouse when it needs reliable reporting, historical analysis, dashboard automation, and cross-system visibility. A warehouse becomes especially useful when data sits in several tools and teams cannot agree on the numbers.
For example, your sales team may use a CRM, your finance team may use accounting software, your marketing team may use ad platforms, your support team may use a ticketing system, and your operations team may use spreadsheets. Each department has useful data. However, leadership needs a combined view.
A data warehouse brings this information together. It allows the business to track KPIs, compare performance over time, identify trends, measure profitability, analyze customer behavior, and build executive dashboards.
A data warehouse also reduces manual Excel reporting. Many companies spend hours each month exporting files, cleaning spreadsheets, copying numbers, and preparing reports. A warehouse can automate much of this work and create a more reliable reporting layer.
If your company needs better KPI visibility, Dashboard Development Services and Power BI Dashboard Services can help turn your data into clear visual reports.
Can a Business Use Both a Database and a Data Warehouse?
Yes. Most growing businesses need both a database and a data warehouse because each one solves a different problem.
The database powers daily operations. It supports the systems that customers, staff, and applications use every day. The data warehouse powers analytics. It supports dashboards, reports, business intelligence, forecasting, and management decision-making.
A simple data flow may look like this:
Business systems → operational databases → ETL or ELT pipelines → data warehouse → dashboards, reports, analytics, and forecasting
This setup improves performance because heavy reporting does not need to run directly on the operational database. It also improves reporting accuracy because data from several systems can be cleaned, standardized, and modeled in one place.
For example, an e-commerce company may use a database to process live orders and a warehouse to analyze revenue trends, customer lifetime value, product performance, and marketing ROI. The database helps the store function, while the warehouse helps the company understand what is working.
Business Maturity Framework: Which System Do You Need?
The right data setup depends on your company’s size, reporting maturity, data sources, and decision-making needs.
| Business Stage | Common Data Situation | Best Starting Point | Why |
|---|---|---|---|
| Small business | One or two systems with basic reports | Database plus clean reporting exports | A full warehouse may not be necessary yet |
| Growing business | Several tools and manual Excel reports | Data cleaning, reporting model, and dashboards | The business needs more reliable reporting |
| Scaling business | CRM, finance, marketing, sales, support, and operations data are disconnected | Data warehouse and BI dashboards | Multiple systems need one reporting layer |
| Data-driven business | Forecasting, segmentation, and machine learning needs | Warehouse, data marts, and predictive analytics workflows | Clean historical data supports deeper analysis |
| Enterprise | Large data volume, many teams, and governance needs | Enterprise data warehouse or lakehouse architecture | Scale, security, governance, and standardization matter |
This framework matters because not every company needs the same solution. A small business may first need better data cleaning and dashboard reporting. A scaling company may need a cloud data warehouse. An enterprise may need a more advanced architecture with governance, data marts, and machine learning readiness.
For advanced forecasting, segmentation, and predictive modeling, businesses may also need Predictive Analytics Services or Machine Learning Services.
Data Warehouse vs Relational Database
A relational database stores data in tables with relationships between them. Common relational databases include MySQL, PostgreSQL, SQL Server, and Oracle Database. These systems often power applications and manage operational records.
A data warehouse may also use relational structures, but it handles a different workload. The real difference is not simply whether the system uses tables. The difference is purpose, design, performance, and business use case.
A relational database works well for transactions. It adds, updates, deletes, and retrieves individual records quickly. A data warehouse works well for analysis. It scans, summarizes, joins, and analyzes large volumes of historical data.
For example, PostgreSQL may power a SaaS application where users log in, update settings, and manage subscriptions. Snowflake, BigQuery, Redshift, or Azure Synapse may support company-wide reporting, dashboards, and executive analytics.
Data Warehouse vs Database for Business Intelligence
Business intelligence works best when data is clean, centralized, and structured properly. A database can support simple operational reports, but most BI reporting needs more than one data source.
For example, a management team may want a dashboard that shows revenue, marketing spend, customer acquisition cost, repeat purchases, customer support trends, and profit margins. This information may come from several systems. If each team exports its own spreadsheet, the business may end up with conflicting numbers.
A data warehouse solves this problem by creating a centralized reporting layer. Once teams clean and model the data, BI tools can connect to the warehouse and generate consistent dashboards.
Common BI tools include Power BI, Tableau, Looker Studio, Excel dashboards, Qlik, and Looker. These tools can create strong reports, but they depend on good data. If the source data is poorly structured, even the best dashboard tool will produce weak reporting.
If your business wants to move from scattered spreadsheets to reliable BI reporting, Business Intelligence Services can help design a cleaner reporting workflow.
Data Warehouse vs Database for Dashboards and Reporting
Dashboards need accurate, consistent, and well-structured data. A dashboard is not just a visual design project. It is also a data quality and reporting logic project.
An operational database may support a simple dashboard if the report only depends on one system. For example, a basic inventory dashboard may connect directly to an inventory database. However, when dashboards require data from several tools, a data warehouse usually works better.
For example, a business using Shopify, Google Ads, HubSpot, QuickBooks, and Zendesk may struggle to create one accurate executive dashboard without a centralized data model. Sales may sit in Shopify, marketing spend may sit in Google Ads, leads may sit in HubSpot, revenue may sit in QuickBooks, and support issues may sit in Zendesk.
A data warehouse can combine these sources, clean the data, and provide a trusted reporting layer. This improves dashboard speed, reduces conflicting numbers, and gives leadership a clearer view of performance.
If your current dashboards are slow, incomplete, or difficult to trust, Dashboard Development Services can help you design dashboards that are clearer, more accurate, and easier to use.
Recommended Reporting Architecture for Growing Businesses
A simple reporting architecture for growing businesses includes four layers.
First, the source system layer includes CRMs, accounting software, e-commerce platforms, marketing tools, spreadsheets, operational databases, and customer support platforms.
Second, the data integration layer moves data from source systems into a central reporting environment through ETL or ELT pipelines.
Third, the data warehouse or reporting model layer cleans, joins, standardizes, and organizes data into reporting-ready tables.
Finally, the dashboard and analytics layer uses tools such as Power BI, Tableau, Looker Studio, or Excel dashboards to help users monitor KPIs and analyze performance.
A practical architecture may look like this:
CRM, finance, marketing, sales, support, and operations systems → data pipelines → data warehouse → BI dashboards and reports
This architecture separates daily operations from analytics. In addition, it reduces manual reporting, improves KPI consistency, and gives decision-makers one trusted place to view business performance.
Cloud Data Warehouse vs Traditional Database
A cloud data warehouse is a modern analytics platform that stores and analyzes large volumes of business data. It supports reporting, dashboards, complex queries, and scalable analytics.
Cloud data warehouses can connect to many systems, handle large datasets, scale with business growth, and support modern BI workflows. Examples include BigQuery, Snowflake, Amazon Redshift, Azure Synapse Analytics, and Databricks SQL Warehouse.
Traditional databases such as MySQL, PostgreSQL, SQL Server, and Oracle remain important. They often power applications, customer systems, payment workflows, order processing, and daily operations.
The goal is not to replace every database with a warehouse. Instead, the goal is to use each system correctly. A business may need a traditional database for operations and a cloud data warehouse for reporting and analytics.
How to Choose Between a Database and a Data Warehouse
Choosing between a database and a data warehouse depends on what the business wants to do with the data. If the goal is to run an application, process transactions, or update live records, a database usually fits better. If the goal is to analyze performance, combine multiple systems, build dashboards, or report KPIs, a data warehouse usually fits better.
| Business Need | Best Option | Why |
|---|---|---|
| Running a web application | Database | Applications need fast live transactions |
| Managing customer accounts | Database | Customer records need frequent updates |
| Processing orders | Database | Orders require real-time transaction handling |
| Tracking inventory | Database | Inventory changes often |
| Recording payments | Database | Payment records need speed and accuracy |
| Building executive dashboards | Data warehouse | Dashboards need clean, integrated data |
| Combining CRM, finance, marketing, and sales data | Data warehouse | Multiple systems need central reporting |
| Analyzing historical trends | Data warehouse | Warehouses support long-term analysis |
| Forecasting revenue | Data warehouse | Forecasting needs historical data |
| Reporting KPIs | Data warehouse | KPIs need consistent definitions |
| Reducing manual Excel reports | Data warehouse | Centralized data reduces manual work |
| Creating a single source of truth | Data warehouse | Teams need one trusted reporting layer |
| Supporting machine learning models | Data warehouse | Models need clean historical datasets |
| Improving BI reporting | Data warehouse | BI tools work better with modeled data |
Signs Your Business May Need a Data Warehouse
Your business may need a data warehouse if reporting has become slow, manual, inconsistent, or difficult to trust. This often happens when the company grows beyond simple spreadsheets or single-system reports.
One common sign is that different departments report different numbers. For example, the sales team may report one revenue figure, while finance reports another. Marketing may calculate customer acquisition cost differently from leadership. Operations may use separate spreadsheets that do not match the main dashboard.
Another sign is that reporting takes too long. If your team spends hours exporting CSV files, cleaning spreadsheets, copying numbers, and preparing monthly reports, your business may benefit from a centralized reporting system.
Slow dashboards can also signal a deeper data problem. If dashboards take too long to load or break when data grows, the underlying reporting structure may need improvement.
A business may need a data warehouse if it wants to track historical trends, automate recurring reports, improve KPI reporting, connect several data sources, reduce Excel dependency, or prepare data for predictive analytics.
Common Mistakes Businesses Make
Many companies know they need better reporting, but they start in the wrong place. The following mistakes often create poor dashboards and weak analytics.
Using an Operational Database for Heavy Reporting
Many businesses run complex reports directly on their operational database. This may work at first, but it can create problems as data grows. Large analytical queries can slow down applications, affect user experience, and make reporting unreliable.
A better approach separates operational workloads from analytical workloads. The database should support daily operations, while the data warehouse should support dashboards and analysis.
Building Dashboards on Messy Data
A dashboard is only as good as the data behind it. If the source data has duplicates, missing values, inconsistent categories, or unclear definitions, the dashboard will produce weak insights.
Before building dashboards, businesses should clean and standardize their data. This improves accuracy and makes reports easier to trust.
Relying Too Much on Spreadsheets
Spreadsheets help with small tasks, but they become risky when they become the main reporting system for a growing business. Manual copy-pasting, formula errors, version control issues, and inconsistent formatting can damage reporting quality.
A data warehouse reduces spreadsheet dependency by creating a more controlled and automated reporting environment.
Choosing Tools Before Designing the Data Structure
Buying Power BI, Tableau, Snowflake, or BigQuery will not automatically solve reporting problems. If the KPIs lack clarity and the data model is weak, the tool will only expose the confusion.
Businesses should first define reporting goals, data sources, metrics, and data quality needs. After that, they can choose the right tools.
Not Defining KPIs Clearly
KPI definitions matter. Revenue, churn, profit margin, customer lifetime value, conversion rate, and active users can all be calculated in different ways. If teams do not agree on definitions, reports will conflict.
A data warehouse can standardize KPI logic so everyone works from the same reporting foundation.
Ignoring Data Governance
Data governance includes access control, data quality checks, documentation, security, and ownership. Without governance, even a well-built data warehouse can become messy over time.
Businesses should define who owns each dataset, who can access reports, how teams check data quality, and how the company documents KPI definitions.
Consultant Insight: The Problem Is Often the Data Structure
Many businesses blame their dashboard tool when reports are slow, confusing, or inconsistent. However, the real problem often sits in the data structure behind the dashboard.
Power BI, Tableau, Looker Studio, and Excel dashboards can all create useful reports when the data is clean and well-modeled. However, if the source data is messy, duplicated, incomplete, or disconnected, the dashboard will still produce poor results.
Before changing BI tools, businesses should ask:
- Are our KPI definitions clear?
- Are our data sources connected correctly?
- Do we clean data before reporting?
- Do departments use the same metric logic?
- Do dashboards connect to reliable reporting tables?
- Do reports run on the right system?
This is why dashboard projects should begin with a data review, not only visual design. A well-designed reporting system starts with clean data, clear KPIs, a practical data model, and the right architecture.
Implementation Roadmap: Moving From Database Reporting to a Data Warehouse
A business does not need to build a complex data warehouse immediately. A practical roadmap can help reduce risk and improve results step by step.
First, audit your current data sources. Identify where important data lives, including CRMs, accounting tools, marketing platforms, websites, spreadsheets, operational databases, and customer support systems.
Second, define the business questions you want to answer. These may include questions about revenue, customers, profitability, marketing performance, operations, retention, or forecasting.
Third, identify reporting pain points. Look for slow dashboards, inconsistent numbers, manual Excel work, missing data, duplicate records, or unclear KPI definitions.
Fourth, clean and standardize key data. This may involve removing duplicates, fixing date formats, standardizing categories, matching customer records, and correcting inconsistent values.
Fifth, design the data model. Decide how sales, customers, products, dates, regions, departments, and financial records should connect.
Sixth, choose the right architecture. Depending on the business, this may involve a cloud warehouse, BI tool, data integration platform, reporting database, or simpler structured reporting setup.
Seventh, build ETL or ELT pipelines. These pipelines move data from source systems into the warehouse or reporting layer.
Eighth, create reporting tables or data marts. This makes dashboards easier to build and improves query performance.
Ninth, connect BI tools such as Power BI, Tableau, Looker Studio, or Excel dashboards.
Finally, validate reports against source systems, document KPI definitions, and monitor data quality over time. A reporting system should improve continuously as the business grows.
How DataScienceConsultingPro.com Can Help
DataScienceConsultingPro.com helps businesses that struggle with scattered data, slow dashboards, manual reporting, inconsistent KPIs, and disconnected systems. Many companies already have useful data, but they cannot turn it into reliable insights because the data sits in too many tools or formats.
We can help review your current data environment, identify reporting problems, clean and organize data, design dashboard-ready structures, and build practical analytics workflows.
Our support may include data warehouse planning, database reporting assessment, data cleaning, data integration, ETL and ELT pipeline planning, dashboard development, Power BI dashboards, business intelligence systems, KPI reporting, data analysis, predictive analytics, machine learning readiness, executive reporting, and reporting automation.
You can start with Data Analysis Services if you need help understanding your data, Data Cleaning Services if your data is messy, or Dashboard Development Services if your goal is to turn data into clear visual reports.
Need help deciding whether your business needs a database, a data warehouse, or a better reporting system? Contact DataScienceConsultingPro.com to request a quote, discuss a data audit, or plan a dashboard and business intelligence project.
Frequently Asked Questions
The main difference is purpose. A database manages daily business transactions, while a data warehouse supports analytics, reporting, dashboards, and business intelligence.
No. A data warehouse stores data, but it does not serve the same purpose as an operational database. A database supports live applications and transactions, while a warehouse supports historical reporting and analysis.
Yes, a database can support basic reporting. However, it may not handle complex dashboards, large historical analysis, or multi-source reporting as well as a data warehouse.
A business should use a data warehouse when it needs to combine data from multiple systems, build dashboards, track KPIs, analyze trends, reduce manual reporting, or create a single source of truth.
Not every small business needs a full data warehouse. However, a small business may benefit from warehouse-style reporting if it uses several systems and struggles with manual reports, inconsistent numbers, or disconnected data.
Yes. SQL is commonly used in both relational databases and data warehouses. However, databases use SQL mainly for transactions and record retrieval, while data warehouses use SQL mainly for analysis and reporting.
A database can work for simple dashboards based on one system. A data warehouse usually works better for advanced dashboards that require historical data, multiple data sources, and consistent KPI definitions.
OLTP supports daily transactions such as orders, payments, bookings, and account updates. OLAP supports analysis, reporting, dashboards, trends, and business intelligence.
ETL means Extract, Transform, Load. ELT means Extract, Load, Transform. Both methods move data from source systems into a data warehouse, but they differ in when transformation happens.
Excel can support small reports, but it cannot reliably replace a data warehouse when a business needs automated reporting, multiple data sources, large datasets, access control, consistent KPIs, and scalable dashboards.
A cloud data warehouse is an online analytics platform that stores, processes, and analyzes large volumes of business data. Examples include BigQuery, Snowflake, Redshift, Azure Synapse Analytics, and Databricks SQL Warehouse.
DataScienceConsultingPro.com can help with data audits, data cleaning, data integration, data warehouse planning, dashboard development, BI reporting, KPI design, predictive analytics, and reporting automation.
Conclusion
The data warehouse vs database comparison matters because both systems store data, but they support different business needs. A database helps a business run daily operations by storing current records, processing transactions, and supporting applications. A data warehouse helps a business analyze performance by combining historical data from different systems and making it ready for dashboards, reports, and business intelligence.
For many growing businesses, the best solution is not choosing one and ignoring the other. Instead, the best solution is using both correctly. The database keeps business systems running, while the data warehouse turns business data into reliable insights.
If your business is dealing with scattered data, slow dashboards, manual Excel reporting, inconsistent KPIs, or disconnected systems, DataScienceConsultingPro.com can help you build a cleaner and more reliable reporting system.