
Data analytics for manufacturing is the use of production, quality, equipment, and supply chain data to reduce downtime, cut defects, and lower cost per unit, moving decisions from gut feel and lagging monthly reports to real time, evidence based action. It combines data engineering, statistics, and machine learning applied specifically to shop floor and enterprise manufacturing data.
The Problem Most Manufacturers Are Actually Facing
Walk onto almost any production floor today and you’ll find no shortage of data. Machines log vibration and temperature. ERP systems record every transaction. Quality stations generate inspection results by the thousands. And yet, ask a plant manager why last week’s downtime happened, and the honest answer is often a shrug, a guess, or a trip through three different systems that don’t talk to each other.
This is the paradox at the center of modern manufacturing: plants are data rich and insight poor. The data to solve most operational problems already exists. It’s rarely collected in one place, rarely cleaned, and almost never connected to the systems that could turn it into a decision before the cost is incurred.
The irony is that most plants aren’t short on technology. Many have already invested in a historian, an MES, IoT enabled sensors, and a modern ERP. What they haven’t invested in is the layer that connects those systems to each other and to the people making decisions on the floor. That layer isn’t a piece of software you buy off a shelf. It’s a combination of data engineering, statistical analysis, and a clear eyed view of which decisions actually move the numbers that matter. Building it is exactly the work described on this page.
That gap shows up as recurring, expensive patterns:
- A bearing fails Thursday that had been vibrating abnormally since Tuesday, and no one was watching.
- A batch gets scrapped because a process parameter drifted, and no one caught it until the inspection station flagged the finished product.
- A plant orders more raw material because “that’s what we did last year,” while the warehouse quietly fills with SKUs no one is buying.
- Three plants report different cost per unit numbers because each one calculates it differently, and no executive can compare them with confidence.
Data analytics for manufacturing exists to close this specific gap. Not to add more dashboards to a plant that already has too many reports no one reads, but to connect the data that already exists into decisions someone can act on in time to matter.
What Data Analytics for Manufacturing Actually Means
At its core, data analytics for manufacturing is the discipline of turning operational data (machine sensors, ERP transactions, MES records, quality logs, and supply chain signals) into decisions that improve throughput, quality, cost, and delivery performance.
It is not the same as traditional plant reporting, for three specific reasons:
| Traditional Reporting | Manufacturing Analytics |
|---|---|
| Weekly or monthly, after the fact | Near real time, as conditions change |
| Descriptive: tells you what happened | Predictive: tells you what’s likely to happen next |
| Lives inside one system (ERP, quality, MES) | Connects data across systems into one view |
A weekly scrap report tells a quality manager what went wrong last week. A properly built analytics pipeline tells them a process parameter is drifting toward a defect causing range right now, while there’s still time to intervene. That distinction, earlier signal, connected data, and a real decision window, is the entire value proposition.
What a Typical Engagement Looks Like
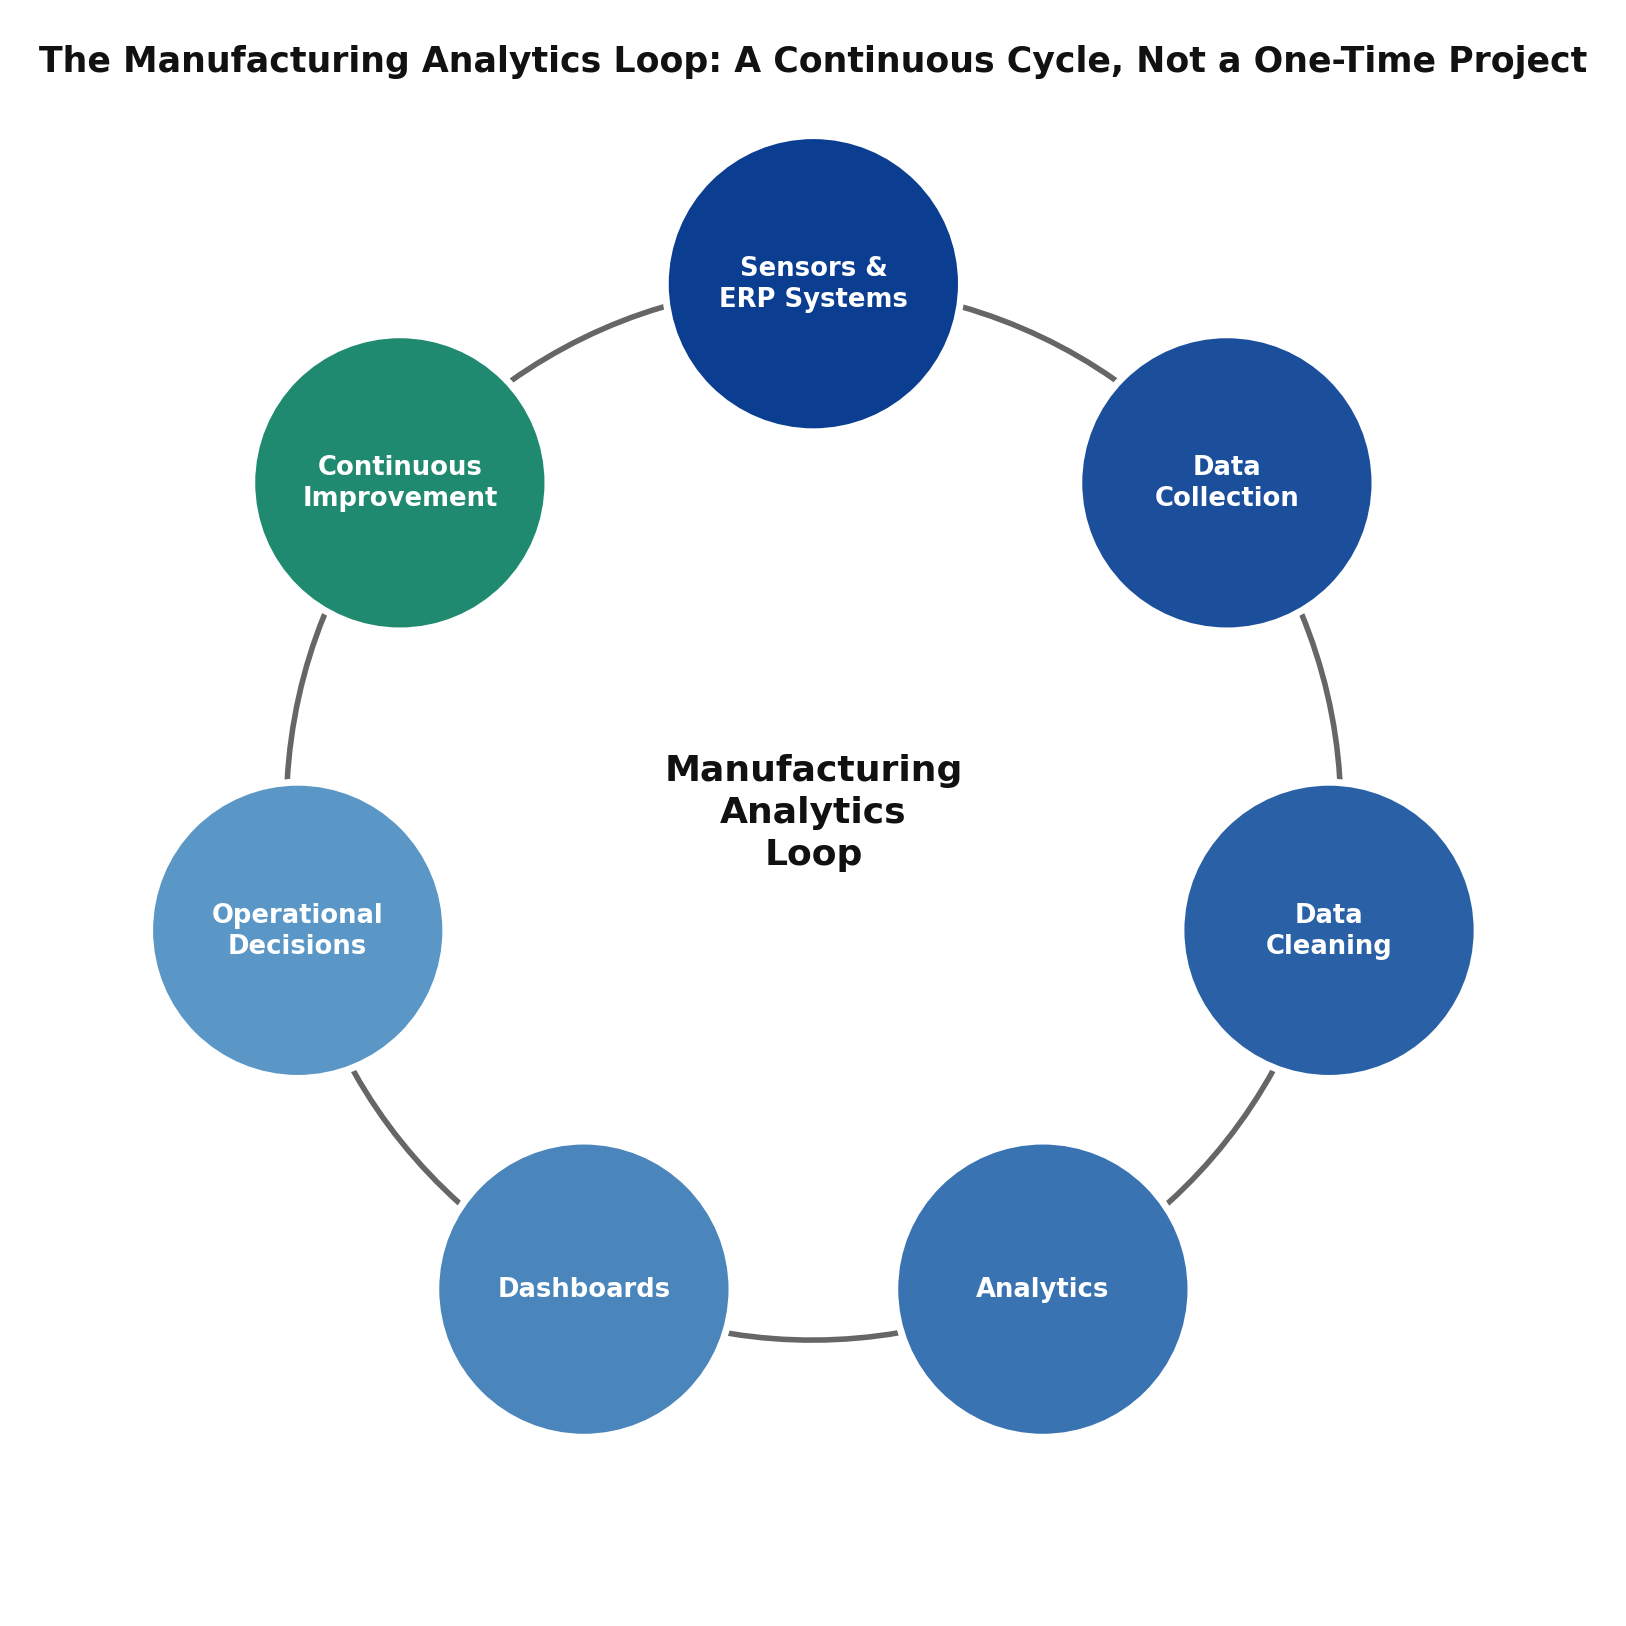
Clients often ask what actually happens after the first call, so here’s the honest shape of it. Timelines vary by scope, but the phases themselves are fairly consistent across engagements.
Phase 1: Discover. We spend time understanding your current systems, your existing data (even the messy, disconnected version of it), and, most importantly, which business outcome matters most right now. This phase often surfaces a different priority than the one a client walked in with, once we can see what the data actually supports quickly versus what would take significant infrastructure work first.
Phase 2: Build the Foundation. This is the data engineering work: connecting to ERP, MES, historian, or quality systems, cleaning the data, and landing it somewhere it can actually be analyzed and trusted. It’s the least visible phase and, honestly, usually the most important one. Skipping it or rushing it is the most common reason analytics projects stall after an initial dashboard fails to hold up under real use.
Phase 3: Deliver the First Decision. Rather than building every possible dashboard at once, we target the first specific decision the data foundation can now support, whether that’s a downtime root cause, a demand forecast, or a predictive maintenance alert, and get it in front of the person who will act on it. This is deliberately narrow. A single working decision that people trust and use builds more organizational momentum than five dashboards no one opens.
Phase 4: Scale and Extend. Once the foundation is proven and trusted, additional use cases get layered on faster, because the hardest part, reliable and connected data, is already done. This is where multi plant rollouts, additional predictive models, and more advanced AI applications typically enter the picture.
Phase 5: Sustain. Manufacturing conditions change: new equipment gets installed, product lines shift, ERP systems get upgraded. We stay engaged to keep the analytics environment current rather than letting it quietly go stale, which is the fate of most one off analytics projects that don’t have ongoing support built in.
Where the Cost Is Actually Hiding, in More Detail
Before getting into services or technology, it’s worth naming the specific problems analytics is built to solve, because manufacturers rarely come to us asking for “analytics.” They come to us with one of these:
- Unplanned downtime that halts a line with no warning and no clear pattern anyone has been able to pin down, often because the sensor data that would reveal the pattern exists but has never been analyzed alongside the maintenance history.
- Equipment failure handled reactively, after the breakdown, instead of on a schedule that fits production, the classic distinction between run to failure maintenance and a genuinely predictive program.
- Low productivity that no one can explain because throughput and utilization aren’t tracked consistently across shifts or lines, which makes it nearly impossible to tell whether a gap is a people problem, an equipment problem, or a scheduling problem.
- Poor quality discovered at final inspection instead of caught while the process parameters were still drifting, meaning the cost of the defect has already been fully incurred by the time anyone finds out about it.
- Supply chain disruptions that surface as a missed delivery instead of an early warning from supplier performance data that was, in most cases, already sitting in a procurement system somewhere.
- Inventory imbalances, too much of the wrong SKU and not enough of the right one, both driven by forecasts that were never grounded in real demand variability by location and product.
- Rising input, energy, and labor costs that get managed at the plant level because no one can see where they’re actually being driven at the process level, shift level, or even individual machine level.
- Demand uncertainty that makes production planning a guessing game, particularly for manufacturers without a formal forecasting process beyond a rolling historical average.
- Data silos between ERP, MES, and quality systems that force someone to manually reconcile numbers before any analysis can even start, often the single biggest time sink for analysts in a plant without integrated data.
- Legacy equipment and control systems that were never designed to share data outside their own four walls, requiring either a retrofit sensor strategy or a creative approach to extracting what data is available.
Every service described below maps back to solving one or more of these problems, not to a generic notion of “getting more data.”
How We Help: Manufacturing Analytics Services by Outcome
Most consulting pages list twenty capabilities in a flat bullet list and leave you to figure out which ones actually matter for your situation. We think that’s backwards. The right starting point isn’t a menu of technologies. It’s the outcome you’re trying to reach. So instead of a flat list, here’s how our services break down by what they’re actually built to deliver: visibility into what’s happening now, prediction of what’s coming next, optimization of the process itself, and, where the data and business case genuinely support it, more advanced capability layered on top of that foundation.
Most engagements start in the first bucket, whether or not that’s where the client initially thought they needed to start. You can’t predict a failure you can’t yet see clearly, and you can’t optimize a process you can’t yet measure consistently. Visibility is rarely the exciting part of the pitch, but skipping it is the single most common reason manufacturing analytics projects stall six months in.
Visibility: Seeing What’s Actually Happening
- Production Analytics: throughput, cycle time, changeover time, and capacity utilization compared consistently across shifts, lines, and plants.
- Operational Analytics: a plant wide view spanning labor, energy, material flow, and equipment utilization together, so cross functional bottlenecks stop hiding between departments.
- Manufacturing Dashboards: real time, role specific views built in Power BI or Tableau, replacing the patchwork of exports and spreadsheets most plants run on.
- Executive Reporting: recurring reporting that connects shop floor KPIs to the financial metrics leadership actually manages against, like cost per unit and margin by product line.
Prediction: Seeing What’s Coming Next
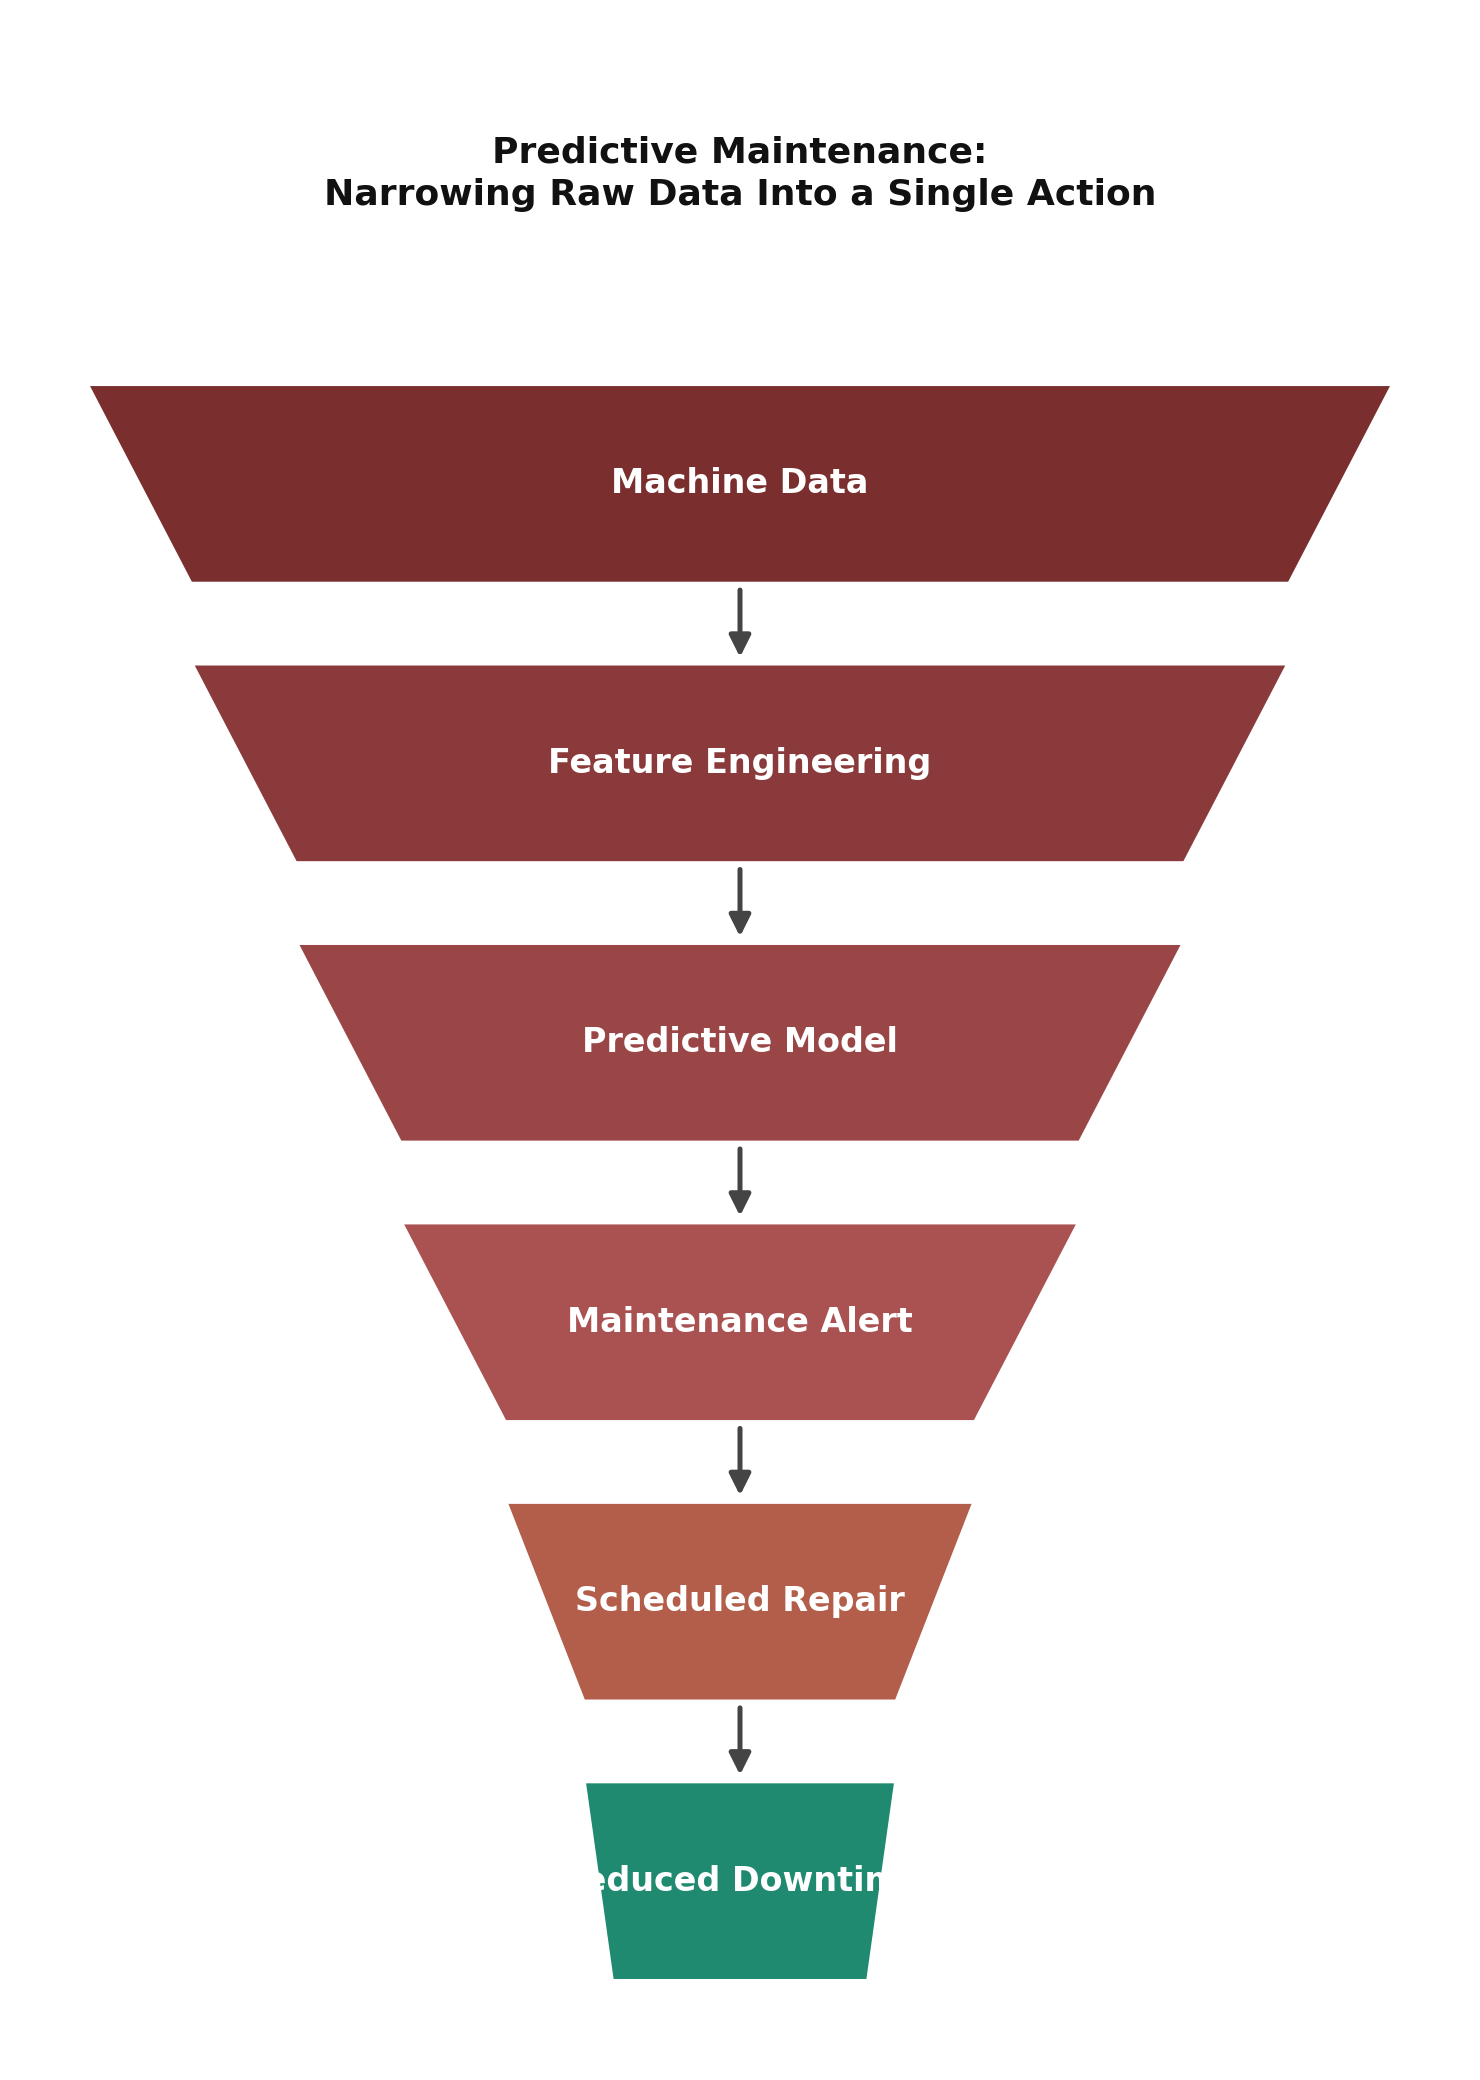
- Predictive Maintenance: sensor driven models that flag equipment trending toward failure, so repairs happen on a planned schedule instead of an emergency one.
- Demand Forecasting: models combining historical sales, seasonality, and demand signals to replace guesswork in production planning and procurement.
- Quality Analytics: process and inspection data connected to catch quality drift before a batch is scrapped, not after.
Optimization: Making the Process Better
- Process Optimization: identifying the parameter combinations that consistently produce the best yield and throughput, often surfacing patterns tribal knowledge missed entirely.
- OEE Optimization: breaking Overall Equipment Effectiveness into its availability, performance, and quality components so improvement work targets the real bottleneck.
- Root Cause Analysis: structured, data driven investigation of recurring downtime or quality problems, rather than the most convenient explanation.
- Inventory Analytics: safety stock and reorder modeling grounded in actual demand variability and lead times.
- Supply Chain Analytics: supplier, transportation, and multi tier visibility that turns disruption response from reactive to proactive.
Advanced Capability: Where the Data Supports It
- Industrial AI: machine learning applied to defect classification, anomaly detection, and complex multi variable process problems.
- Data Engineering: the pipelines that extract, clean, and standardize data from ERP, MES, historian, and IoT platforms so every downstream project has something reliable to build on.
- Machine Learning: applied to forecasting, scheduling, and anomaly detection wherever pattern recognition outperforms manual analysis.
- IoT Analytics: ingestion and analysis architecture for high volume sensor data, often with edge pre processing.
- Real Time Analytics: for processes where minutes matter, surfacing issues as they happen rather than after the shift ends.
- Cost Reduction Analytics: connecting cost data to operational data to show exactly where cost per unit is being driven up.
- Energy Consumption Analytics: identifying waste by comparing energy use against production volume.
- Workforce Analytics: connecting labor scheduling and skills data to production outcomes.
Several of these, including predictive maintenance, industrial AI, supply chain analytics, and Power BI or Tableau implementation specifically, are deep enough disciplines to warrant their own dedicated pages: Predictive Maintenance Analytics, AI for Manufacturing, Supply Chain Analytics Consulting, and Power BI Consulting.
Industries Where We Apply This
Manufacturing data looks different depending on what you make, and the right analytics approach shifts accordingly. We work across:
- Automotive: production line analytics, supplier quality scoring, and warranty data connected back to process conditions.
- Aerospace: traceability requirements and first pass yield tracking under stringent quality documentation standards.
- Electronics: high mix, high volume production analytics where defect patterns shift quickly across product changeovers.
- Food & Beverage: batch quality and shelf life analytics alongside food safety compliance data.
- Pharmaceuticals: process validation and batch record analytics built around regulatory reporting requirements.
- Chemicals: continuous process optimization and yield analytics, often paired with safety monitoring.
- Textile: production efficiency and quality consistency tracked across long, continuous runs.
- Packaging: high speed line analytics where changeover time has an outsized effect on total throughput.
- Consumer Goods: demand forecasting and inventory analytics across large, fast moving SKU portfolios.
- Heavy Equipment: long cycle production planning and component level quality tracking.
- Steel & Metals: energy analytics and continuous process optimization at scale.
- Plastics: cycle time optimization and scrap reduction in injection and extrusion processes.
Each of these carries its own data profile and regulatory backdrop, from ISO quality management expectations to sector specific safety and traceability requirements, and our analytics work is built to operate within those constraints, not around them.
The Metrics This Work Actually Moves
Most manufacturing analytics engagements ultimately show up in a small set of well known KPIs. If you already track these, analytics sharpens them; if you don’t track them consistently across shifts and lines yet, that’s often the first project.
| KPI | What It Measures |
|---|---|
| Overall Equipment Effectiveness (OEE) | Combined availability, performance, and quality for an asset or line |
| First Pass Yield | Percentage of units produced correctly without rework |
| Scrap Rate | Percentage of material or units lost to defects |
| Cycle Time | Time required to complete one production cycle |
| Throughput | Units produced over a given time period |
| Inventory Turnover | How often inventory is sold and replaced over a period |
| On Time Delivery | Percentage of orders delivered by the promised date |
| Downtime | Time equipment is unavailable for production |
| Production Cost per Unit | Total production cost divided by units produced |
| Capacity Utilization | Percentage of total production capacity actually used |

Why This Compounds Over Time (And Why the First Project Rarely Looks Like the Biggest Win)
It’s worth being direct about something manufacturers new to analytics often misunderstand: the first project is rarely the one that delivers the biggest financial result. The first project is almost always about building the data foundation: integrating ERP, MES, and quality data, cleaning it, and making it trustworthy. The second and third projects are where the compounding value shows up, because they’re built on top of a foundation that already works.
Manufacturers who understand this going in tend to stay the course. Manufacturers who expect the first dashboard to transform the business are often disappointed, not because the analytics didn’t work, but because the sequencing was never explained.
The other factor that determines whether analytics sticks is how it’s introduced to the floor. When operators and supervisors see analytics used to find and fix problems, adoption happens fast. When it’s perceived as a tool to assign blame, even a well built model gets quietly worked around. Part of every engagement is helping plant leadership frame the rollout so it builds trust instead of resistance.
Done well, this work compounds into:
- Higher productivity through clearer visibility into bottlenecks and utilization
- Reduced downtime through predictive maintenance and faster root cause work
- Improved quality through real time process monitoring
- Optimized inventory through demand grounded stock modeling
- Better forecasting than a historical average alone can produce
- Less waste through tighter process control
- Higher profitability as the combined effect of the above
- Better decisions through a single source of truth instead of five disconnected reports
- Improved customer satisfaction through more reliable delivery and fewer quality escapes
- Stronger sustainability reporting through energy and waste analytics
One practical note on measuring whether any of this is actually working: agree on the specific metric an engagement is meant to move before the project starts, not after. “Improve analytics” isn’t a measurable goal. “Reduce unplanned downtime on Line 3 by a meaningful, defined margin within two quarters” is. We build this kind of specific, agreed upon success measure into the scope of every engagement, and we report against it on a regular cadence rather than leaving it as a vague aspiration to revisit at some undefined future point.
The Technology Behind It (Chosen for Your Environment, Not Ours)
We work across three layers of the stack, and the right combination depends entirely on what you already run, not on whichever platform happens to be trending in a given year.
Ingestion. Getting data out of machines, ERP, and quality systems is often the most underestimated part of any project since industrial data rarely exports cleanly on its own. Historians and PLCs frequently use proprietary protocols, MES systems vary widely in how (and whether) they expose an API, and ERP data models differ enough between vendors that a connector built for one system rarely works unmodified for another. This is where Industrial IoT platforms and custom connectors come in, and it’s usually where a realistic timeline gets set for the rest of the project.
Storage and Processing. Cleaning, joining, and scaling data uses Python, R, SQL, and platforms like Snowflake, Databricks, Apache Spark, Azure, AWS, and Google Cloud, selected based on your data volume and analytics complexity. A single plant generating a few gigabytes of sensor data a month has very different infrastructure needs than a multi plant enterprise ingesting continuous IoT streams from hundreds of machines.
Presentation. This is where insight actually reaches a decision maker, typically through Power BI, Tableau, or Microsoft Fabric, and packaged for reliable deployment using Docker and Kubernetes. This layer matters more than it’s usually given credit for: a technically excellent model that never makes it in front of the person who needs to act on it delivers zero business value.
A single plant manufacturer already licensed for Power BI has a very different right answer than a multi plant enterprise standardizing on Databricks and Snowflake, and we’re comfortable telling a client their existing tools are the right call when that’s genuinely true. We don’t have a house platform we push regardless of fit, and we’d rather scope a smaller, right sized project than sell infrastructure a client’s team can’t realistically maintain once we’re gone.
Case Study: Connecting Data That Already Existed
A mid sized automotive parts manufacturer running three shifts across two lines had a stamping line with recurring unplanned downtime and an elevated scrap rate, but no way to connect the two. Maintenance logs, MES quality records, and machine sensor data all lived in separate systems, and monthly reports only ever showed the outcome, never the driver. Plant leadership suspected the two problems were related but had no way to prove it, since answering that question meant manually cross referencing three separate exports every time an incident occurred.
What we did:
- Integrated the data: historian, MES quality records, and maintenance management system, into one analytics environment.
- Found the actual pattern: a subset of downtime events consistently preceded scrap spikes on the same line, pointing to a die wear pattern no one had been tracking as a leading indicator.
- Built a predictive model: using vibration and cycle count data to flag approaching wear thresholds before scrap began.
- Replaced the weekly paper report: with a real time dashboard showing die wear alongside OEE and scrap rate.
Illustrative results: a meaningful reduction in unplanned downtime on the affected line, a lower scrap rate through earlier intervention, and faster root cause identification going forward, because supervisors could see the leading indicator directly instead of waiting for next month’s report.
The pattern here is typical: the biggest win rarely comes from a single sophisticated model. It comes from connecting data that was already being collected but never analyzed together.
Why Manufacturers Choose DataScienceConsultingPro.com
- Manufacturing specific expertise: hands on experience with production, quality, and supply chain data, not generic BI applied to a factory setting.
- Built around your data, not a template: every engagement starts with your specific systems and business goals.
- Enterprise grade security: access control and data security considered from day one, not bolted on afterward.
- Architecture that scales: from a single line to a multi plant enterprise, without a rebuild in eighteen months.
- Straight answers: you’ll know what we’re building, why, and what it costs before we start.
- Scoped around outcomes: every engagement is tied to a business result, whether that’s less downtime, better quality, or lower cost per unit.
- Support that continues: analytics isn’t a one time deliverable; we stay engaged as your data and equipment evolve.
We ground our recommendations in the frameworks and standards published by organizations including NIST, ISO, and technology partners such as Microsoft, AWS, Google Cloud, Siemens, Rockwell Automation, and IBM, rather than a one off opinion.
We also try to be honest about what analytics can’t do. It won’t fix a fundamentally broken process, replace the judgment of an experienced plant manager, or substitute for basic equipment maintenance that’s been deferred for years. What it does is give the people who already know your operation better information, faster, so their judgment has something reliable to act on. Clients who come in with that expectation tend to get the most value out of the engagement, and it’s why our first conversation is usually more diagnostic than sales oriented.
Investment
Manufacturing analytics engagements vary widely with facility count, data sources, and system complexity. Use this as a starting point, not a final quote.
| Package | Suitable For | Estimated Price |
|---|---|---|
| Starter | Small manufacturers, single facility, one or two data sources | $2,000 to $7,500 |
| Professional | Medium sized manufacturers, multiple lines or facilities, ERP/MES integration | $7,500 to $30,000 |
| Enterprise | Large manufacturers and global operations, multi plant, AI implementation | Custom Quote |
What moves the final number:
- Number of facilities
- Number and type of data sources
- ERP integrations required
- Number and type of IoT devices
- Dashboard complexity
- Whether AI/machine learning is in scope
- Project timeline
- Industry specific compliance requirements
Frequently Asked Questions
The use of production, quality, equipment, and supply chain data to reduce downtime, cut defects, and improve efficiency across manufacturing operations.
Manufacturing analytics is built around plant specific data, such as machine sensors, MES, and quality records, and often includes predictive elements, where a standard BI dashboard just visualizes existing business data.
No. Many manufacturers get substantial value from existing ERP, MES, and quality data before adding any new sensors.
Initial dashboard and reporting work often takes a few weeks to a few months; predictive maintenance or AI implementations typically take longer.
At minimum, historical production, quality, and downtime data. Sensor data, maintenance logs, and supply chain records extend what’s possible.
Yes. We integrate with major ERP and MES platforms rather than requiring replacement.
Both; the Starter package is built specifically for smaller manufacturers with limited data infrastructure.
Using sensor and maintenance history to predict when equipment is likely to fail, so repairs happen proactively instead of reactively.
Overall Equipment Effectiveness combines availability, performance, and quality into one metric, highlighting exactly where losses occur.
Python, R, SQL, Power BI, Tableau, and cloud platforms including Azure, AWS, and Google Cloud, chosen for your specific environment.
Both, depending on the use case. Some problems are well served by established tools; others need models built around your specific process data.
Enterprise security practices and access controls appropriate to your industry are designed in from the start of the engagement.
It varies by use case; we scope each engagement around a specific, measurable outcome rather than a generic ROI figure.
Yes. Analytics is an ongoing capability, and we stay engaged as data and business needs evolve.
A consultation reviewing your current data, systems, and priorities to scope the right starting point.
Based on facility count, data sources, integrations, dashboard complexity, and whether AI/ML is included; we provide a specific quote after understanding your requirements.