
By Pius Imwene, Data Analyst and Data Science Consultant at Data Science Consulting Pro | Last updated: October 2026
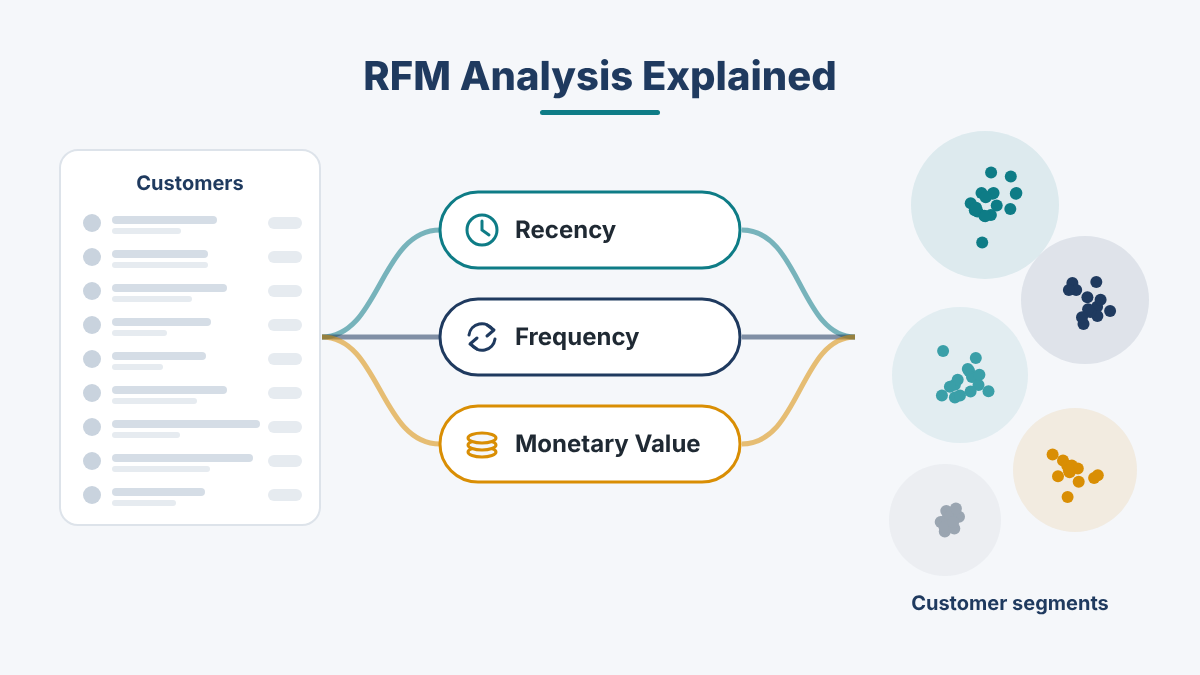
Here is RFM analysis explained in one sentence: it ranks every customer by how recently they bought, how often they buy and how much they spend.
Most businesses already hold the data to do this. Their order system contains thousands of customers and years of transactions. Yet when someone asks “Who are our best customers?” or “Who is quietly drifting away?”, the answer usually comes from memory or a list of the largest invoices.
That gap is expensive. The same discount email goes to a loyal customer who would have bought anyway and to a one-time buyer who lost interest a year ago. Valuable customers slip into inactivity before anyone notices.
This guide shows you how to close that gap. It covers the formulas, a fully scored eight-customer example, ten segments with a measurable action for each, and how to adapt the method for e-commerce, B2B and subscription businesses. You can also download a free Excel template that does the calculations for you.
| Key Takeaways RFM scores each customer on Recency (days since last purchase), Frequency (number of purchases) and Monetary value (total spend), usually from 1 to 5.The three scores combine into a code such as 545, which maps to a segment like Champions, At Risk or Lost.Cutoffs should match your normal purchase cycle. Six months of silence is alarming for a coffee subscription and routine for a furniture retailer.Revenue is not profit. Using margin as the monetary measure can change who looks valuable.RFM describes past behavior. Pair it with churn prediction or customer lifetime value models when you need forecasts. |
What Is RFM Analysis?
RFM analysis is a customer segmentation method that groups customers by three behaviors in their purchase data. RFM stands for Recency, Frequency and Monetary value.
The technique has long been used in catalog and direct marketing, where every mailing cost money and companies had to decide who deserved one. The logic still holds. Customers who bought recently, buy often and spend more are generally more likely to respond to the next offer than customers who bought once, long ago, for a small amount.
RFM is useful because it relies on behavior rather than assumptions. Age or location might hint at a customer’s value, but a purchase history shows it directly. And because the only inputs are a customer ID, an order date and an order value, almost any business can build an RFM model.
The output is not a prediction. It is a ranking that lets you treat different customers differently, with a clear reason behind each decision.
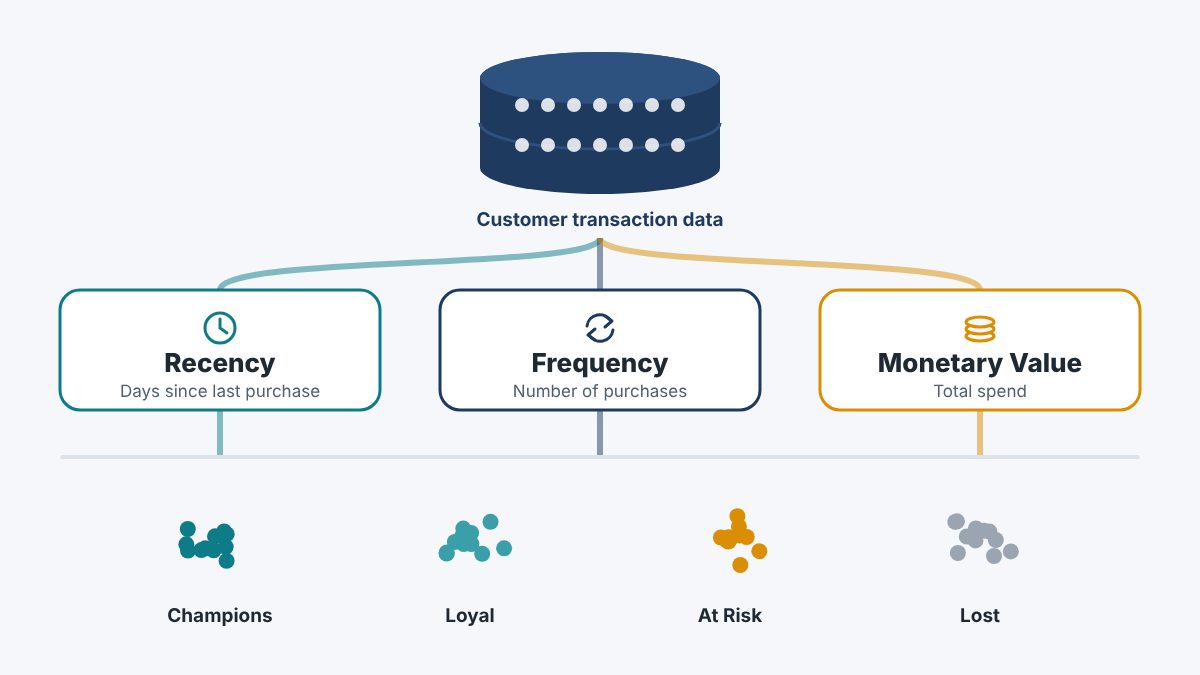
Recency, Frequency and Monetary Value
Each dimension captures a different part of customer value. Together, they separate customers who look similar on any single measure.
Recency
Recency is the number of days since a customer’s most recent purchase. It is often the strongest of the three signals: a customer who bought last week is still engaged, while one who last bought fourteen months ago may have moved on.
Recency = Analysis date − Date of most recent qualifying purchase (in days)
If a pet-supply store’s analysis date is 30 September, a customer who last ordered on 12 September has a recency of 18 days. For recency, a smaller number is better.
Frequency
Frequency counts qualifying purchases within the analysis window, often the last 12 months. It reflects habit: ten orders signal a routine, while one order means the customer has only tried you.
Frequency = Number of qualifying purchases in the analysis window
Decide what “qualifying” means before you calculate anything. Most businesses count each completed order once, whatever it contains, and exclude fully refunded orders, cancellations and internal test orders.
Monetary Value
Monetary value is the total a customer spent in the analysis window. It separates customers who buy often but cheaply from those who buy rarely but spend heavily.
Monetary value = Total qualifying spend in the analysis window
Revenue is the simplest measure and works when margins are similar across products. When they are not, revenue misleads. A customer who spends $3,000 on discounted clearance stock may contribute less profit than one who spends $1,200 at full price. In that case, use gross or contribution margin instead, and document the choice, because it changes who looks valuable.
How RFM Analysis Works: Step by Step
- Collect transaction data: a customer ID, order date and order value for every order.
- Clean and deduplicate customer records. The same person often appears under two email addresses, and refunds may be recorded inconsistently. Skip this step and one loyal customer looks like two occasional ones. When records are messy, cleaning and deduplicating customer data is what makes the segments trustworthy.
- Set the analysis date and window. The analysis date is the “today” you measure from. Twelve months suits many retailers; slower businesses may need 24 months or more.
- Calculate recency, frequency and monetary value for each customer.
- Score each dimension from 1 to 5.
- Combine the scores into a three-digit code such as 534.
- Map codes to segments using rules such as “R 4–5, F 4–5, M 4–5 = Champions”.
- Give each segment an action and a success metric, such as a win-back sequence measured by the share of customers who reorder within 60 days.
- Refresh the analysis on a schedule, monthly for most retailers, and track how customers move between segments.
Steps 1 and 2 take the most effort. Steps 8 and 9 create most of the value, because a segment nobody acts on changes nothing.
RFM Scoring and How to Choose Cutoffs
The usual approach gives each dimension a score from 1 to 5, where 5 is best. Higher frequency and spend earn higher scores, but recency runs the other way: fewer days earns a higher score. Reversing this by mistake produces segments that are exactly backwards, so check it first.
Three ways to set cutoffs
- Quintiles split customers into five equal-sized groups on each dimension. They are simple and adjust automatically, but they are purely relative. If most customers bought only once, quintiles may give different frequency scores to customers with identical order counts.
- Custom percentiles reserve top scores for exceptional customers, for example a 5 for the top 10% only.
- Business-defined thresholds use fixed values, such as “R5 = bought within 30 days”. They are easy to explain and stay stable, so you can compare segment sizes month to month.
A practical path is to start with quintiles to see how your data is distributed, then switch to business-defined thresholds once you know what normal looks like.
Match cutoffs to your purchase cycle
The most important judgment is what counts as “recent”. A customer who buys every six months is not inactive if six months is your normal cycle, as it may be for a furniture retailer. For a coffee subscription, the same silence almost certainly means the customer has switched to a competitor.
The most reliable starting point is the typical gap between purchases among your repeat customers. If the median gap is 45 days, a customer at 90 days has missed about two expected orders, which is a real warning. If the median gap is 200 days, the same 90 days means nothing.
What is a good RFM score?
There is no universal good RFM score. A 555 means a customer is in your top band on all three dimensions under your own rules, not that they meet an industry benchmark. The more useful question is whether a customer’s score is rising or falling.
RFM Analysis Example
Here is a complete RFM analysis example for Harbour & Pine Home Goods, a fictional online homeware retailer. The analysis date is 30 September 2026 and the window covers the previous 12 months. The eight customers below come from a base of several thousand. Because a typical repeat customer orders every one to three months, the retailer uses these thresholds:
- Recency score: 5 = 30 days or fewer; 4 = 31–60; 3 = 61–120; 2 = 121–240; 1 = more than 240
- Frequency score: 5 = 10 or more orders; 4 = 6–9; 3 = 3–5; 2 = 2; 1 = 1
- Monetary score: 5 = $2,000 or more; 4 = $1,000–$1,999; 3 = $400–$999; 2 = $150–$399; 1 = under $150
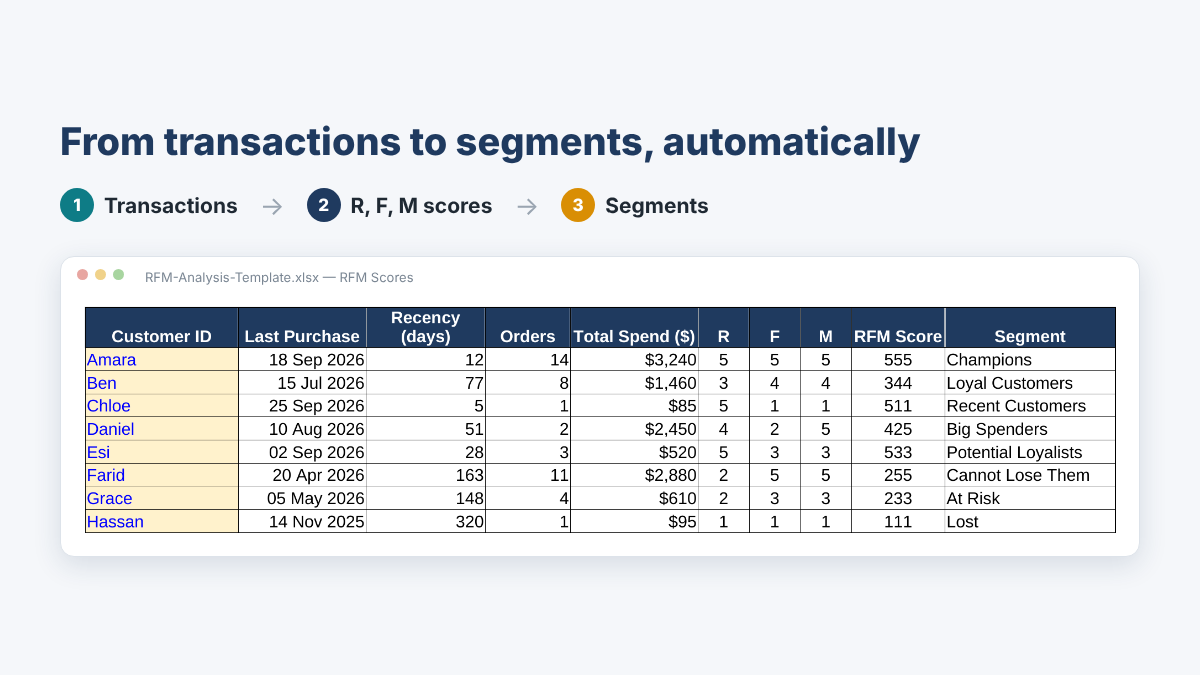
Table 1: RFM Analysis Example
| Customer | Last Purchase | Recency (days) | Orders | Total Spend | R | F | M | RFM Score | Segment |
| Amara | 18 Sep 2026 | 12 | 14 | $3,240 | 5 | 5 | 5 | 555 | Champions |
| Ben | 15 Jul 2026 | 77 | 8 | $1,460 | 3 | 4 | 4 | 344 | Loyal Customers |
| Chloe | 25 Sep 2026 | 5 | 1 | $85 | 5 | 1 | 1 | 511 | Recent Customers |
| Daniel | 10 Aug 2026 | 51 | 2 | $2,450 | 4 | 2 | 5 | 425 | Big Spenders |
| Esi | 2 Sep 2026 | 28 | 3 | $520 | 5 | 3 | 3 | 533 | Potential Loyalists |
| Farid | 20 Apr 2026 | 163 | 11 | $2,880 | 2 | 5 | 5 | 255 | Cannot Lose Them |
| Grace | 5 May 2026 | 148 | 4 | $610 | 2 | 3 | 3 | 233 | At Risk |
| Hassan | 14 Nov 2025 | 320 | 1 | $95 | 1 | 1 | 1 | 111 | Lost |
The combination of scores matters more than any single number:
- Farid (255) is the most urgent case. He has 11 orders and $2,880 in spend, but 163 days of silence against a one-to-three-month cycle. A personal email or call asking what changed is worth more than a generic promotion.
- Amara (555) is a Champion. Reward her with early access or a personal thank-you rather than discounts, which would only give away margin on purchases she would make anyway.
- Chloe (511) placed her first order five days ago. Her low frequency and spend scores are not a problem; the goal is a strong second purchase through a welcome series.
- Daniel (425) has ordered only twice but spent $2,450. Recommend complementary premium items rather than low-cost add-ons.
The table cannot tell you why Farid stopped buying. RFM shows you where to look; finding the reason takes conversations, feedback or further analysis.
[ IMAGE 2 — SCREENSHOT FROM THE FREE RFM EXCEL TEMPLATE ]
RFM Customer Segments and What to Do With Each
Once every customer has a code, the codes are grouped into segments that marketing, sales and service teams can act on. The names below are widely used conventions, not industry standards, so adapt both the names and the ranges to your business.
The ten segments fall into three groups:
- Protect and grow: Champions, Loyal Customers and Big Spenders.
- Develop: Recent Customers, Potential Loyalists and Promising customers.
- Decide how much to invest in winning back: Cannot Lose Them, At Risk, Hibernating and Lost.
Check the rules in table order; the first match wins. Any customer who matches no rule should be reviewed rather than forced into a label.
Table 2: RFM Customer Segments and Recommended Actions
| Segment | Typical RFM Pattern | What It Means | Recommended Business Action |
| Champions | R 4–5, F 4–5, M 4–5 | Bought recently, buy often and spend the most. | Offer early access, referral invitations and personal recognition instead of discounts. Track referrals over 90 days. |
| Loyal Customers | R 3–5, F 4–5, M 3–5 | Buy regularly and spend well. | Invite them into a loyalty tier or bundle offer. Track average order value over the next two orders. |
| Big Spenders | R 3–5, F 1–3, M 5 | Spend heavily but buy infrequently. | Recommend premium complementary products. Track next-order rate within 90 days. |
| Recent Customers | R 5, F 1, M 1–4 | Just made a first purchase. | Send a welcome sequence with one tailored suggestion. Track second-purchase rate within 60 days. |
| Potential Loyalists | R 4–5, F 2–3, M 2–4 | Recent buyers building a habit. | Offer membership or a time-limited reason to reorder. Track moves into Loyal within a quarter. |
| Promising | R 3–4, F 1, M 1–4 | Bought once, fairly recently. | Send a refill or matching-item reminder. Track second-purchase rate within 90 days. |
| Cannot Lose Them | R 1–2, F 4–5, M 4–5 | Former top customers gone quiet. | Contact them personally to ask what changed, then make a tailored offer. Track reactivation and feedback themes. |
| At Risk | R 2, F 2–5, M 2–5 | Established customers slipping away. | Run a short win-back sequence. Track reorders within 60 days against a hold-out group. |
| Hibernating | R 2, F 1–2, M 1–3 | Low-value and inactive. | Include them only in low-cost seasonal campaigns. Track response against campaign cost. |
| Lost | R 1, F 1–3, M 1–3 | Low-value, gone a long time. | Send one final reactivation attempt, then reduce contact. Track reactivation and unsubscribes. |
Start with five to eight segments that will genuinely receive different treatment. Four segments with distinct, measured actions beat ten that all get the same newsletter.

Turning segments into measurable results
Every segment needs one owner, one action and one metric. For example: “At Risk customers receive a three-email win-back sequence, and success is the share who reorder within 60 days.”
Where practical, hold back a small random control group from each campaign. Without one, you cannot tell how many customers would have bought anyway, and the campaign takes credit for sales it did not cause. Over time, track segment migration, such as how many At Risk customers return to Loyal each month. That movement is the clearest evidence your customer retention strategy is working.
Adapting RFM for E-commerce, B2B and Subscription Businesses
Standard RFM assumes repeated, separate purchases. That fits some business models far better than others.
E-commerce
Set recency around replenishment cycles. A skincare brand whose customers reorder every six to eight weeks might send a reminder at 70 days and treat 120 days as At Risk. Use margin if prices vary widely, and merge guest checkouts so one person is not counted as several customers. For more on how this applies to online retailers, see our e-commerce analytics page.
B2B
B2B buying is often irregular and contract-driven. A manufacturer’s best account may place one large order a year, which consumer-style cutoffs would flag as a lapsing customer. To adapt:
- analyze at account level rather than by individual buyer
- use a longer window, such as 24 to 36 months
- use contract value or margin as the monetary measure
- judge recency against each account’s expected reorder or renewal date
Non-transactional signals help too: an account still requesting quotes is not the same as one that has gone silent.
SaaS and Subscriptions
Recurring billing breaks frequency, because every subscriber “buys” monthly whether they use the product or not. Replace transactions with engagement: recency becomes days since the last login, frequency becomes active days, and monetary value becomes monthly recurring revenue. A high-paying customer with falling activity is a churn risk that traditional RFM would miss.
How to Do RFM Analysis in Excel, SQL, Python and Power BI
The right tool depends on your data volume, how often you refresh and who uses the results.
RFM analysis in Excel
Excel suits small and medium customer lists. Use MAXIFS, COUNTIFS and SUMIFS to get each customer’s last order date, order count and spend, subtract dates for recency, and score with nested IF rules or PERCENTRANK.INC. The free template is built exactly this way. The weakness is maintenance, since refreshes are manual unless you automate imports with Power Query.
RFM analysis in SQL
SQL is the natural choice when orders already sit in a database. Aggregate by customer, then score with the NTILE function, which splits rows into a set number of groups:
SELECT customer_id,
DATEDIFF(day, MAX(order_date), ‘2026-09-30’) AS recency_days,
COUNT(*) AS frequency,
SUM(order_value) AS monetary
FROM orders
WHERE order_date BETWEEN ‘2025-10-01’ AND ‘2026-09-30’
GROUP BY customer_id;
Saved as a view, the analysis refreshes automatically and can feed any reporting tool.
RFM analysis in Python
Python with pandas suits larger datasets and teams that want to add clustering or predictive models. A groupby builds the raw values, and pandas qcut assigns quantile-based scores:
rfm = orders.groupby(“customer_id”).agg(
last=(“order_date”, “max”),
frequency=(“order_id”, “count”),
monetary=(“value”, “sum”))
rfm[“recency”] = (analysis_date – rfm[“last”]).dt.days
rfm[“R”] = pd.qcut(rfm[“recency”], 5, labels=[5, 4, 3, 2, 1])
f_rank = rfm[“frequency”].rank(method=”first”)
rfm[“F”] = pd.qcut(f_rank, 5, labels=[1, 2, 3, 4, 5])
Ranking frequency first avoids errors when many customers share the same order count.
RFM analysis in Power BI
Power BI turns scores into a live view of the customer base. DAX measures calculate recency, frequency and spend per customer, a SQL view or calculated column supplies the segment, and visuals show segment size and month-over-month movement.
Whichever tool you choose, document the analysis date, window, qualifying-purchase rules and cutoffs so each month’s results are comparable.
RFM Analysis vs Other Customer Segmentation Methods
Demographic segmentation describes who customers are, not how they behave. It works best alongside RFM, for example to check whether Lost customers cluster in one region.
Clustering algorithms such as k-means find natural groups across many variables, including RFM values. They can reveal segments nobody thought to define, but the results are harder to explain to marketing teams.
Customer lifetime value (CLV) looks forward, while RFM looks backward. The two are closely linked: academic research has modelled CLV directly from recency, frequency and monetary inputs (Fader, Hardie and Lee, 2005). RFM is faster and easier to act on; CLV is better for setting acquisition and retention budgets. Building RFM first is rarely wasted effort.
Churn prediction models estimate each customer’s probability of leaving, using RFM variables alongside other signals. With enough history they usually flag risk more precisely than fixed rules, as in our customer churn prediction example project. RFM still adds value next to them, because it explains a customer’s status in plain language.
Choose RFM when you need fast, explainable segments from transaction data. Add other methods when you need forecasts or insight into motivation.
Benefits and Limitations of RFM Analysis
RFM’s strengths are simplicity, interpretability and a low barrier to entry: three metrics, standard formulas, and segments anyone in the business understands. Because segments map directly to campaigns, it supports personalization, surfaces retention risks early and helps direct limited budgets.
Its limitations are just as clear:
- It relies on transaction history, so it says little about new customers.
- It may ignore profit when revenue is used as the monetary measure.
- It does not explain why a customer behaves as they do.
- It oversimplifies, hiding dependence on promotions or a single product category.
- It suits long sales cycles less well without adapted windows.
- It does not predict the future. A 555 describes the past year, not next month.
Treat RFM as a foundation, then add margin data, customer feedback and predictive models when a decision justifies the extra work.
Common RFM Analysis Mistakes
- Copying arbitrary thresholds from a tutorial or another company.
- Ignoring purchase cycles, so healthy customers are flagged as lapsed.
- Treating revenue as profit, which makes discount-driven customers look like Champions.
- Creating too many segments that never receive distinct treatment.
- Failing to act on segments once the scores are calculated.
- Using outdated data, even though customers change segments every month.
- Ignoring business context such as seasonality, price changes or stock shortages.
- Scoring every customer identically, when wholesale and retail customers need separate models.
Taking RFM Further
Once a basic model works, these extensions add accuracy or foresight:
- RFM + profitability: replace revenue with contribution margin, net of returns and shipping, to see who actually generates profit.
- RFM + churn prediction: feed RFM variables into predictive analytics models to flag risk earlier than fixed score bands.
- RFM + clustering: use machine learning techniques such as k-means clustering to test whether your rule-based segments match natural groupings.
- RFM + product affinity: combine segments with category purchase patterns to decide what to offer, not only whom to contact.
- RFM + next-purchase forecasting: alert when a customer is overdue against their own pattern rather than a fixed cutoff, which is especially useful in B2B.
How Data Science Consulting Pro Can Help With RFM Analysis
The method is simple. Running it reliably is where many teams get stuck:
- Messy data: duplicate customers, inconsistent dates and refunds recorded as negative orders must be fixed first.
- Choosing cutoffs: thresholds should come from your real repeat-purchase intervals and margins, then be tested for sensitivity.
- Automating refreshes: SQL or Python pipelines can rescore customers on a schedule instead of a manual spreadsheet routine.
- Making segments visible: custom dashboards in Power BI and similar tools show segment sizes and movement for marketing and leadership.
- Going predictive: churn, lifetime value and clustering models add foresight when your data supports them.
Our RFM analysis services and wider customer segmentation services start from the data you already have. If you are unsure whether you need a one-off project or ongoing customer analytics consulting, a short conversation usually makes that clear.
| [ CTA 2 ] Ready to see which customers drive your business? Tell us about your customer data and goals, and we will suggest a practical approach, from a one-off RFM model to automated monthly segment reporting. Book a free data review to discuss your project. Explore our current analytics service options and pricing. |
Frequently Asked Questions
RFM analysis is a customer segmentation method that ranks customers by how recently they bought, how often they bought and how much they spent. Each customer receives a score for each dimension, usually from 1 to 5, and the combined scores place customers into segments such as Champions, At Risk and Lost so businesses can tailor marketing and retention.
RFM stands for Recency, Frequency and Monetary value. Recency is the number of days since a customer’s last purchase, frequency is the number of purchases in a set period such as 12 months, and monetary value is the amount spent in that period, measured as revenue or margin.
Calculate each customer’s raw recency, frequency and monetary values from transaction data. Convert each into a 1–5 score using quintiles or business-defined thresholds, remembering that fewer days since the last purchase earns a higher recency score. Then combine the three scores into a code such as 455.
There is no universal good RFM score, because scores depend on your own customers and cutoffs. Codes with 4s and 5s on all three dimensions, such as 555 or 454, mark your strongest customers. Direction matters more than the number: a valuable customer whose recency score is falling needs attention.
Common segments include Champions, Loyal Customers, Big Spenders, Recent Customers, Potential Loyalists, Promising, Cannot Lose Them, At Risk, Hibernating and Lost. These are conventions rather than standards, so most businesses adapt the names and score ranges and act on five to eight segments.
Yes, with adaptations. Analyze at account level, use a longer window such as 24 to 36 months, measure value by contract value or margin, and judge recency against each account’s expected reorder or renewal date rather than a single fixed cutoff.
Yes. Use MAXIFS, COUNTIFS and SUMIFS to find each customer’s last order date, order count and total spend, subtract dates for recency, and score each value with threshold rules. Our free RFM template does this automatically. For very large datasets or automatic refreshes, SQL, Python or Power BI are easier to maintain.
RFM relies on past transactions, so it says little about new customers and nothing about why customers behave as they do. Revenue-based scores can hide unprofitable customers, poor cutoffs create misleading segments, and the method describes the past rather than predicting it. Combining RFM with margin data and predictive models addresses most gaps.
Conclusion
RFM analysis turns a transaction history you already own into a clear, ranked view of your customers. The method is simple; the value comes from the decisions around it. Use cutoffs that match your purchase cycle and a monetary measure that reflects profit. Act on a few well-defined segments, and refresh regularly so you can see customers move.
