What Is Business Intelligence? Examples and Benefits
Business intelligence is the process of using business data to create reports, dashboards, and insights that help people make better decisions. It helps business owners, managers, and teams understand what is happening across sales, marketing, finance, operations, customers, and overall performance.
Every business creates data. Sales create data. Customers create data. Marketing campaigns create data. Accounting software creates data. Websites, CRMs, spreadsheets, booking systems, inventory tools, and operations reports all create data. The problem is that this data is often scattered across different tools and hard to understand.
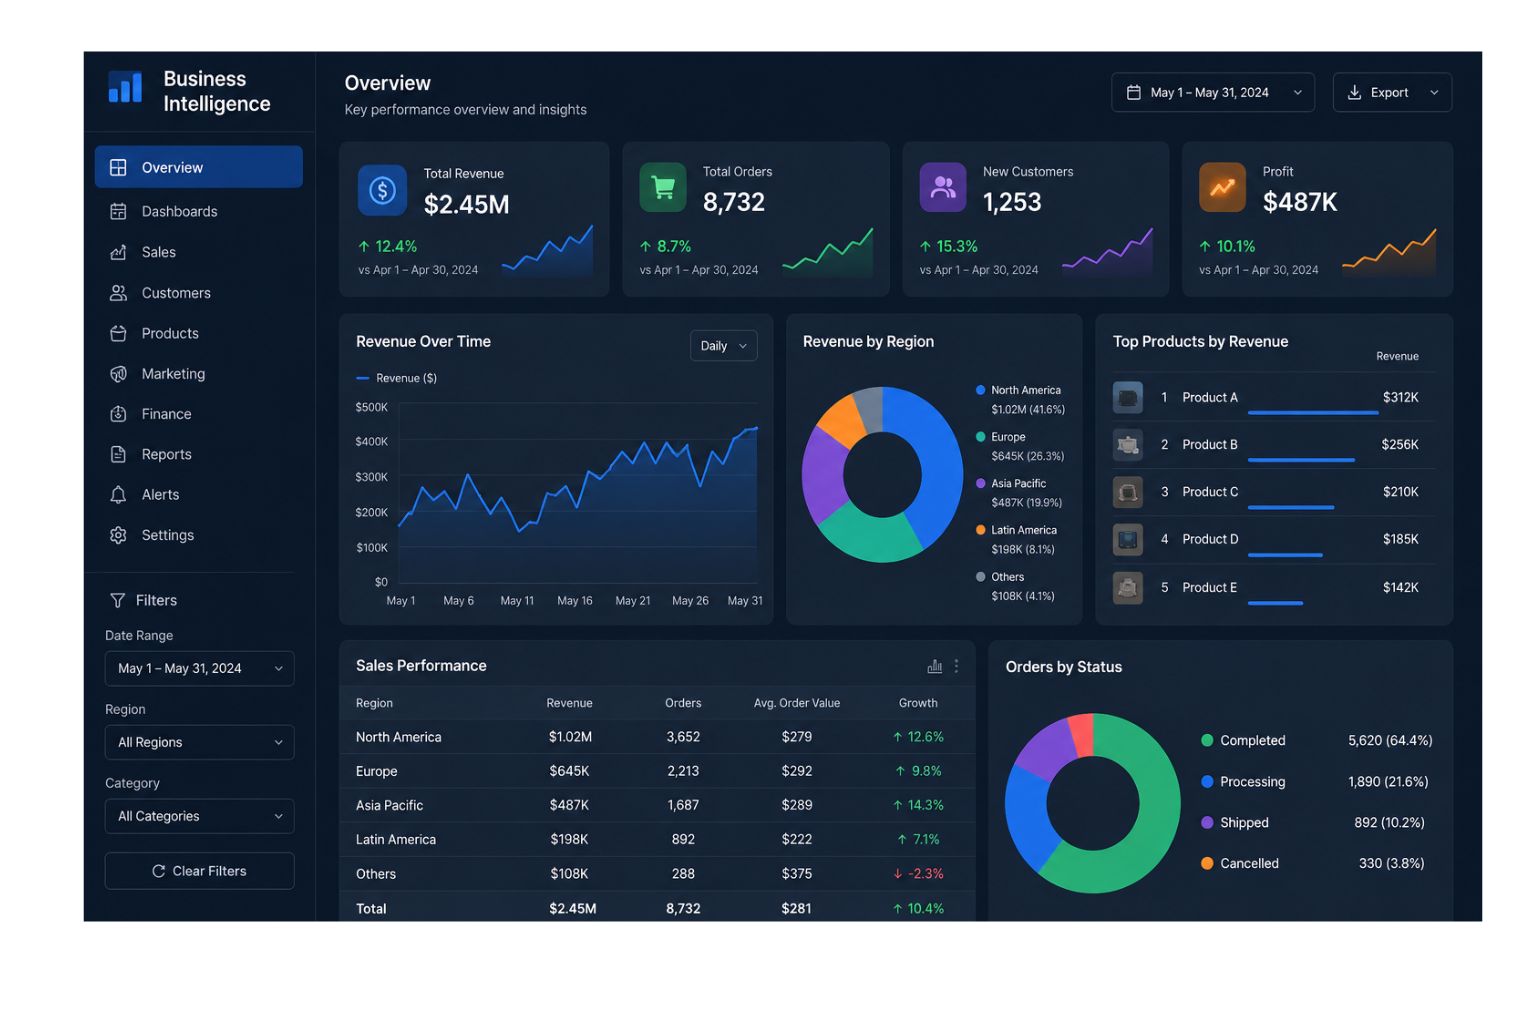
That is where business intelligence becomes useful. Instead of forcing leaders to open several spreadsheets, check different systems, and guess what the numbers mean, business intelligence brings important data into one clearer view. A BI dashboard can show revenue, profit, leads, conversion rates, expenses, customer growth, inventory levels, and other key performance indicators in one place.
In simple terms, business intelligence helps a business answer questions like: What is happening right now? What changed? Which area needs attention? Which products, customers, or channels are performing best? What should we review next?
For small businesses, business intelligence does not have to start with complex software. It can begin with clean data, simple reports, dashboards, and a clear understanding of which numbers matter most.
If your business needs help turning messy data into clear reports, dashboards, or forecasts, our Data Analysis Services can help.
Quick Answer: What Is Business Intelligence?
Business intelligence, often called BI, is the process of collecting, organizing, analyzing, and presenting business data so leaders can understand performance and make better decisions.
Business intelligence usually focuses on reports, dashboards, KPIs, charts, and performance tracking. It helps a business see what is happening across different areas of the company.
| Business Question | How Business Intelligence Helps |
|---|---|
| What is happening in the business? | Shows current performance through dashboards and reports |
| What changed recently? | Compares trends across days, weeks, months, or quarters |
| Which areas need attention? | Highlights problems, risks, and underperforming metrics |
| Which areas are performing well? | Shows strong products, teams, customers, or channels |
| What should leaders review next? | Points decision-makers toward the most important numbers |
For example, a business intelligence dashboard may show that sales are increasing, but profit margin is shrinking. That gives leaders a clearer reason to review costs, pricing, discounts, or fulfillment expenses.
The main purpose of business intelligence is not just to display data. The purpose is to make business performance easier to understand.
Business Intelligence Turns Reports Into a Decision System
Business intelligence is most valuable when it turns scattered reports into a clear decision system. Many businesses already have reports, but those reports are often disconnected. Sales may have one spreadsheet, marketing may have another dashboard, finance may use accounting software, and operations may track work in a separate file. When every team looks at different numbers, leaders struggle to see the full picture.
A strong BI process brings the most important numbers into one clear view. It helps the business move from “Where is the report?” to “What does the report tell us?” That shift matters because the goal of business intelligence is not just to collect data. The goal is to help people understand performance and take action faster.
For example, a business may use a BI dashboard to track revenue, profit margin, leads, conversion rates, customer growth, expenses, and cash flow. Instead of waiting until the end of the month to find problems, leaders can review performance during the month and respond earlier.
| Before Business Intelligence | After Business Intelligence |
|---|---|
| Reports are spread across spreadsheets and tools | Key metrics are brought into one clearer view |
| Teams debate which numbers are correct | Teams review the same trusted numbers |
| Leaders wait too long for updates | Dashboards and reports update more efficiently |
| Decisions are based on guesses | Decisions are based on visible performance |
| Reporting takes hours every week | Reporting becomes faster and more consistent |
This is why business intelligence is not only a reporting tool. It is a decision system. When BI is set up well, it helps the business understand what is happening, what changed, what needs attention, and what action should happen next.
Business Intelligence in Simple Terms
Business intelligence is a way to turn business data into useful information. Instead of looking at raw numbers in spreadsheets, a company can use BI reports and dashboards to see performance clearly.
A business may have sales data in a CRM, marketing data in Google Ads or Meta Ads, finance data in accounting software, and operations data in spreadsheets. Each source may be useful, but none of them tells the full story on its own. Business intelligence helps bring those numbers together so leaders can see a clearer picture.
For example, a sales report may show that revenue increased. A marketing report may show that ad spend increased. A finance report may show that profit decreased. When those reports are separate, it may be hard to understand what is really happening. A BI dashboard can connect the numbers and show that revenue grew because of higher ad spend, but profit dropped because customer acquisition cost increased too much.
That kind of visibility helps a business make better decisions. Instead of guessing, leaders can see what changed, where the problem is, and what needs attention.
Business intelligence is especially useful for businesses that have data in multiple places. When reports are scattered, inconsistent, or manually updated, decision-making becomes slower. BI helps create one clearer view of performance.
Why Business Intelligence Matters for Businesses
Business intelligence matters because most businesses already have useful data, but they are not always using it well. The data may exist, but it may be messy, hard to access, or spread across too many tools.
A business owner may know monthly revenue but not know which product created the most profit. A marketing manager may know how many leads came in, but not know which leads became customers. A finance team may know expenses increased, but not know which cost category is causing the biggest issue. Business intelligence helps connect those numbers.
Good BI makes it easier to understand performance without relying on guesswork. It gives teams a way to review the same numbers, track the same KPIs, and make decisions from a shared view of the business.
| Benefit | Business Impact |
|---|---|
| Clearer reporting | Leaders can see important numbers in one place |
| Faster decisions | Teams spend less time searching for data |
| Better performance tracking | KPIs can be reviewed consistently |
| Improved accountability | Teams understand which numbers they own |
| Less manual work | Reports can be updated more efficiently |
| Stronger planning | Trends help leaders prepare for future needs |
| Better visibility | Sales, marketing, finance, and operations can be connected |
| Fewer reporting errors | Clean dashboards reduce spreadsheet confusion |
The value of business intelligence is clarity. When leaders can see performance clearly, they can act faster. They can increase investment in what is working, fix what is not working, and avoid making decisions based only on opinions.
If your reports are hard to understand or take too long to update, our Data Analysis Services can help you build clearer reporting.
Business Intelligence vs Data Analytics
Although business intelligence and data analytics are closely related, they are not exactly the same. In most cases, business intelligence focuses on reporting, dashboards, and tracking what is happening in the business. By contrast, data analytics is broader and may include deeper analysis, forecasting, and recommendations.
A simple way to understand the difference is this: business intelligence helps you monitor performance, while data analytics helps you understand and improve performance.
| Topic | Business Intelligence | Data Analytics |
|---|---|---|
| Main focus | Reports, dashboards, KPIs, and performance tracking | Analysis, patterns, forecasts, and recommendations |
| Main question | What is happening? | Why did it happen, what may happen next, and what should we do? |
| Common output | BI dashboard or report | Analysis, dashboard, forecast, or recommendation |
| Best for | Monitoring business performance | Understanding problems and finding opportunities |
| Example | Monthly sales dashboard | Sales trend analysis and revenue forecast |
For example, a BI dashboard may show that leads dropped by 20%. Data analytics may help explain why the leads dropped, whether the issue came from SEO, ads, email, website conversion, or seasonal demand.
A business often needs both. Business intelligence gives a regular view of performance. Data analytics helps investigate the numbers and decide what to do next.
For a deeper comparison, read Data Analytics vs Data Analysis: What Is the Difference?.
How Business Intelligence Works
Business intelligence works by collecting business data, organizing it, and presenting it in a useful format. The final output is usually a dashboard, report, scorecard, or performance summary.
The process usually starts with data sources. These may include CRM systems, accounting software, ecommerce platforms, spreadsheets, advertising platforms, website analytics, customer support tools, inventory systems, or operations reports.
Once the data sources are identified, the data needs to be cleaned and organized. This is important because messy data creates unreliable reporting. If customer names are inconsistent, product categories are not standardized, or dates are formatted differently across files, the final dashboard may show incorrect numbers.
After the data is cleaned, it can be analyzed and visualized. BI tools can turn the data into charts, KPI cards, tables, trend lines, and dashboards. These visuals make it easier for leaders to understand performance without digging through raw spreadsheets.
The final step is decision-making. Business intelligence should help a business decide what needs attention, what is working, and what action should happen next.
| Step | What Happens | Example |
|---|---|---|
| Collect data | Gather data from business systems | CRM, accounting, ads, spreadsheets |
| Clean data | Fix errors and organize fields | Remove duplicates and standardize names |
| Combine data | Bring useful data together | Connect sales, marketing, and finance data |
| Visualize data | Create charts, reports, and dashboards | KPI dashboard or executive report |
| Review insights | Understand performance | Identify trends, risks, and opportunities |
| Take action | Use the information to decide next steps | Adjust budget, pricing, staffing, or sales focus |
Business intelligence is most valuable when it becomes part of the way a business operates. A dashboard is not useful if no one reviews it. A report is not useful if it does not support a decision. The goal is to make reporting clear, consistent, and tied to action.
The Business Intelligence Process: From Raw Data to Better Decisions
A good business intelligence process does not start with a dashboard. It starts with a business question. The company first needs to know what it wants to understand, what decision needs to improve, and which numbers matter most.
For example, a business may want to understand whether marketing spend is creating profitable customers. That question may require data from ad platforms, website analytics, CRM records, sales reports, and finance data. If those numbers are not connected, the business may only see part of the story.
Once the question is clear, the next step is to collect and clean the right data. This is important because BI dashboards are only as reliable as the data behind them. If customer names are duplicated, product categories are inconsistent, or sales numbers are entered differently across systems, the final report may be wrong.
After the data is organized, the business can build a dashboard or report around the most important KPIs. A good BI dashboard should not show every possible metric. It should show the numbers that help the business make better decisions.
The final step is regular review. Business intelligence becomes powerful when leaders use the reports consistently. A dashboard that no one reviews does not improve the business. A dashboard that is reviewed weekly or monthly can help teams spot problems, track progress, and make better decisions.
| BI Step | What It Means | Business Example |
|---|---|---|
| Define the question | Decide what the business needs to understand | Which marketing channel creates profitable customers? |
| Identify data sources | Find where the needed data lives | CRM, accounting software, ad platforms, spreadsheets |
| Clean the data | Fix errors and standardize information | Remove duplicates and align product names |
| Choose KPIs | Select the numbers that matter most | Revenue, profit, leads, conversion rate, cash flow |
| Build the report | Create a dashboard or recurring report | Sales dashboard or executive KPI report |
| Review regularly | Use the report to guide decisions | Weekly leadership review or monthly performance meeting |
| Take action | Change strategy based on insights | Adjust budget, pricing, staffing, or sales focus |
The best BI systems are simple enough to use and strong enough to support real decisions.
Business Intelligence Examples
Business intelligence can be used in almost every part of a business. It can help sales teams track pipeline performance, marketing teams measure campaign results, finance teams monitor profit, and operations teams identify bottlenecks.
| Business Area | Business Intelligence Example | Decision It Supports |
|---|---|---|
| Sales | Sales dashboard tracking revenue, pipeline, and close rate | Improve sales performance and forecasting |
| Marketing | Campaign dashboard tracking leads, cost, and conversions | Spend more on channels that produce results |
| Finance | Profit and expense dashboard | Control costs and improve margins |
| Operations | Workflow dashboard tracking delays and output | Fix bottlenecks and improve efficiency |
| Customer service | Support dashboard tracking tickets and response time | Improve service quality |
| Inventory | Stock dashboard tracking product movement | Avoid shortages and reduce waste |
| Executive reporting | Leadership dashboard tracking company KPIs | Make faster strategic decisions |
For example, a sales manager may use a BI dashboard to see revenue by rep, pipeline value, win rate, average deal size, and forecasted sales. Instead of waiting until the end of the month to understand performance, the manager can review trends throughout the month and act earlier.
A marketing team may use business intelligence to compare website traffic, ad spend, leads, conversion rates, and customer acquisition cost. This helps the team understand which channels are producing real customers, not just clicks or impressions.
A finance team may use BI reporting to track revenue, expenses, gross profit, net profit, cash flow, and budget performance. This gives leadership a clearer view of the company’s financial health.
Sales Business Intelligence Example
Sales business intelligence helps a company understand revenue performance, sales activity, pipeline health, and customer trends. A sales team may have data in a CRM, spreadsheets, emails, or quoting tools. BI can bring that data into a clearer dashboard.
A sales dashboard may show revenue, number of deals, pipeline value, close rate, average deal size, sales cycle length, and forecasted revenue. These numbers help managers understand whether the team is on track.
For example, a business may see that total leads are high, but closed revenue is lower than expected. A BI dashboard may show that the issue is not lead volume. The issue may be that qualified leads are low, close rate is declining, or deals are taking longer to close.
That insight helps the business focus on the right problem. Instead of simply asking sales reps to work harder, leadership can improve lead quality, sales follow-up, pricing, or pipeline management.
Marketing Business Intelligence Example
Marketing business intelligence helps a company understand which channels, campaigns, and activities are producing results. This is important because marketing reports can easily become crowded with numbers that look impressive but do not always lead to revenue.
A marketing dashboard may track website traffic, leads, cost per lead, conversion rate, ad spend, email performance, SEO traffic, and revenue by channel. The goal is not only to see which campaign generated clicks. The goal is to understand which marketing activities create real business value.
For example, one ad campaign may produce many leads at a low cost, but those leads may rarely become customers. Another channel may produce fewer leads, but those customers may spend more and stay longer. Business intelligence helps reveal that difference.
This helps marketing teams move beyond vanity metrics and focus on the numbers that support growth.
Finance Business Intelligence Example
Finance business intelligence helps a company understand revenue, expenses, margins, cash flow, and profitability. This is one of the most important uses of BI because revenue alone does not show whether a business is healthy.
A company may grow revenue while profit gets worse. This can happen when costs rise faster than sales. Advertising costs, labor costs, software costs, delivery fees, inventory costs, and vendor expenses can all affect margin.
A finance dashboard can show revenue, gross profit, net profit, expenses, cash flow, accounts receivable, and budget performance. It can also compare performance by month, product, customer, location, or department.
For example, a business may discover that one service brings in a lot of revenue but requires too much labor. Another service may bring in less revenue but creates stronger profit. That insight can influence pricing, staffing, and sales strategy.
Good finance BI helps leaders understand not only how much money came in, but what is left after costs.
Operations Business Intelligence Example
Operations business intelligence helps a business understand how work gets done. It can show delays, bottlenecks, output, workload, capacity, and quality issues.
An operations dashboard may track delivery time, order completion, error rates, customer wait time, production output, staff workload, or service turnaround time. This helps managers see where work slows down.
For example, a company may discover that customer orders are usually delayed at the same step in the process. Without BI, the team may blame staffing or workload. With better reporting, the business may see that one approval step, vendor delay, or handoff process is causing most of the issue.
This kind of visibility helps a business improve efficiency without guessing.
Customer Business Intelligence Example
Customer business intelligence helps a company understand customer behavior, retention, satisfaction, and value. It can show which customers buy most often, which customers are most profitable, and which customers may be at risk of leaving.
A customer dashboard may track repeat purchases, churn, customer lifetime value, complaints, support tickets, satisfaction scores, and average order value. These numbers help a business understand customer quality, not just customer count.
For example, a business may discover that repeat customers produce more profit than new customers. With that insight, the company may invest more in retention, follow-up emails, loyalty offers, or customer service improvements.
Customer BI helps businesses focus on relationships that create long-term value.
Common Business Intelligence Tools
Business intelligence tools help businesses organize, visualize, and report on data. The best tool depends on the size of the business, the data sources, the reporting goals, and the people who will use the dashboards.
| Tool | Best For | Good Fit For |
|---|---|---|
| Excel | Basic reports, pivot tables, and charts | Small businesses and simple analysis |
| Google Sheets | Shared reports and lightweight dashboards | Teams that collaborate online |
| Power BI | Automated dashboards and business reporting | Growing businesses with Microsoft tools |
| Tableau | Interactive dashboards and visual reporting | Teams needing strong visualization |
| Looker Studio | Website, marketing, and Google reporting | SEO and marketing dashboards |
| SQL | Pulling and organizing database data | Businesses with structured databases |
| CRM reports | Sales pipeline and customer tracking | Sales teams |
| Accounting reports | Revenue, expenses, and cash flow | Finance teams |
A small business may start with Excel or Google Sheets. As reporting becomes more important, the business may move to Power BI, Tableau, Looker Studio, or another BI platform.
The right tool is not always the most advanced tool. The right tool is the one that helps the business answer important questions clearly and consistently.
If your team spends hours updating reports manually, it may be time to review whether a dashboard or automated reporting system would save time.
What a Good Business Intelligence Dashboard Should Include
A good business intelligence dashboard should be simple, focused, and tied to decisions. It should not include every possible number. Too many charts can make the dashboard harder to use.
A strong BI dashboard usually includes the most important KPIs for the audience. An executive dashboard may include revenue, profit, cash flow, customer growth, and forecasted performance. A sales dashboard may include leads, pipeline value, close rate, and revenue. A marketing dashboard may include traffic, leads, conversion rates, and cost per customer.
| Dashboard Type | Useful KPIs |
|---|---|
| Executive dashboard | Revenue, profit margin, cash flow, customer growth, forecast |
| Sales dashboard | Leads, pipeline, close rate, deal size, revenue |
| Marketing dashboard | Traffic, leads, conversion rate, cost per lead, ROI |
| Finance dashboard | Revenue, expenses, profit, cash flow, margin |
| Operations dashboard | Output, delays, workload, errors, capacity |
| Customer dashboard | Retention, churn, complaints, satisfaction, repeat purchases |
The best dashboards help users answer practical questions. Are we on track? What changed? What needs attention? Which area is performing best? What decision should we make next? A dashboard should make the business clearer, not more complicated.
Business Intelligence Dashboard Checklist
Before building a business intelligence dashboard, it helps to review what the dashboard actually needs to do. A dashboard should not be built just because the business has data. It should be built because there is a decision, report, or performance issue that needs to become clearer.
A useful BI dashboard should have a clear audience. An executive dashboard should not look the same as a marketing dashboard. A finance dashboard should not track the same metrics as an operations dashboard. The best dashboard is designed around the person who will use it and the decisions they need to make.
It should also use clean data. If the source data is messy, the dashboard will not be trustworthy. Before building charts, the business should make sure the data is accurate, consistent, and updated often enough to support decisions.
| Dashboard Question | Why It Matters |
|---|---|
| Who will use this dashboard? | Helps choose the right metrics and layout |
| What decision should it support? | Keeps the dashboard focused on business value |
| Which KPIs matter most? | Prevents the report from becoming overcrowded |
| Where does the data come from? | Helps confirm source reliability |
| Is the data clean enough to trust? | Prevents misleading charts |
| How often should it update? | Determines whether reporting should be manual or automated |
| What action should happen after review? | Connects the dashboard to business decisions |
A dashboard should make the next step easier. If the user sees a drop in revenue, a rise in costs, or a change in conversion rate, the dashboard should help them know what to review next.
Business Intelligence Benefits
Business intelligence can create value across the entire business. It helps teams understand performance, reduce manual reporting, identify problems earlier, and make better decisions.
One major benefit is time savings. Many teams spend hours every week copying numbers from different tools into spreadsheets. BI can reduce that manual work by creating dashboards or reports that update more efficiently.
Another benefit is consistency. When different teams use different spreadsheets, leaders may end up with different versions of the truth. Business intelligence helps standardize reporting so everyone can review the same numbers.
BI also improves decision-making. When leaders can see revenue, costs, marketing, sales, and operations clearly, they can make decisions based on evidence instead of guesswork.
| Benefit | Why It Matters |
|---|---|
| Saves time | Reduces manual reporting work |
| Improves accuracy | Reduces spreadsheet errors and inconsistent numbers |
| Builds trust | Gives teams a shared view of performance |
| Supports faster action | Helps leaders spot changes earlier |
| Improves planning | Makes trends easier to review |
| Increases accountability | Teams can track the KPIs they own |
| Supports growth | Helps identify strong products, customers, and channels |
| Protects profit | Makes cost and margin issues easier to see |
The strongest benefit is clarity. Business intelligence helps leaders understand what is happening and what deserves attention.
Business Intelligence Helps Teams See the Same Version of the Truth
One of the biggest problems in business reporting is that different teams often use different numbers. Sales may report one revenue figure, finance may report another, and marketing may use a separate lead count. When this happens, meetings become less about decisions and more about debating which report is correct.
Business intelligence helps reduce this problem by creating a shared reporting structure. When data sources, definitions, and KPIs are clear, teams can spend less time arguing about numbers and more time improving performance.
For example, leadership may define exactly what counts as a qualified lead, a closed sale, monthly recurring revenue, gross profit, or customer churn. Once those definitions are clear, BI dashboards can track them consistently.
This shared view is especially important as a business grows. A small team may be able to manage with a few spreadsheets, but as more people, tools, and departments are added, reporting can become messy quickly. BI helps create structure before the confusion becomes expensive.
| Reporting Problem | BI Solution |
|---|---|
| Different teams use different spreadsheets | Create one shared dashboard or reporting process |
| Metrics are defined differently | Standardize KPI definitions |
| Reports take too long to prepare | Automate or simplify recurring reports |
| Leaders do not trust the numbers | Clean and validate source data |
| Meetings focus on report confusion | Use consistent data for decision-making |
A strong BI process helps teams align around the same facts. That does not mean every decision becomes easy, but it does mean the business starts with clearer information.
Business Intelligence for Small Businesses
Small businesses often assume business intelligence is only for large companies. That is not true. Small businesses can benefit from BI because they often need clearer reporting but do not have large data teams.
A local service business can use BI to track leads, bookings, revenue, expenses, and customer repeat rate. A restaurant can track sales by menu item, labor cost, busy days, and customer patterns. An ecommerce store can track product sales, ad spend, conversion rates, refunds, and inventory. A consulting firm can track lead sources, project value, close rate, and revenue by service.
For small businesses, BI should start simple. The first goal is not to build a complex system. The first goal is to create one clear view of the numbers that matter most.
A small business may start with a monthly KPI report, a sales dashboard, a marketing dashboard, or a finance summary. As the business grows, the reporting can become more automated and detailed.
The best BI project starts with a useful business question. For example, a company may want to know which customers are most profitable, which products should be promoted, whether the marketing channel is working, where costs are rising, and which reports take too long to create.
A simple answer to the right question can create real value.
What Business Intelligence Looks Like for a Small Business
For a small business, business intelligence does not have to mean complex software, large databases, or a full data team. It can start with a simple dashboard or monthly report that brings the most important numbers into one place.
A local service business may use BI to track leads, booked jobs, revenue, repeat customers, and monthly expenses. An ecommerce business may track traffic, conversion rate, product sales, ad spend, refunds, and inventory. A consulting company may track lead sources, project value, close rate, delivery time, and revenue by service.
The value comes from clarity. A small business owner should be able to look at the report and quickly understand what is working, what is slowing down, and where attention is needed.
| Small Business Type | Useful BI Metrics |
|---|---|
| Local service business | Leads, booked jobs, revenue, repeat customers, expenses |
| Ecommerce store | Product sales, ad spend, conversion rate, refunds, inventory |
| Consulting firm | Lead source, project value, close rate, revenue by service |
| Restaurant | Sales by menu item, labor cost, busy days, customer patterns |
| Real estate business | Leads, deals, revenue, expenses, occupancy, cash flow |
| Agency | Client revenue, project margin, delivery time, retention |
The best BI setup for a small business is the one the owner or manager will actually use. A simple report reviewed every week is often more valuable than an advanced dashboard that no one opens.
Step-by-Step: How to Start With Business Intelligence
The best way to start with business intelligence is to begin with one clear business goal. Do not start by choosing software. Start by deciding what the business needs to understand.
First, define the decision you want to improve. For example, you may want to understand which marketing channel produces the best customers, which products create the most profit, or whether the business is on track to hit monthly revenue goals.
Next, identify the data sources needed to answer that question. Sales data may come from a CRM. Marketing data may come from ad platforms or website analytics. Finance data may come from accounting software. Operations data may come from spreadsheets or internal tools.
After that, clean and organize the data. This step matters because messy data creates unreliable dashboards. Customer names, product categories, dates, and revenue fields should be consistent.
Then, build a simple report or dashboard. Start with the most important KPIs. Avoid adding every metric at once. A focused dashboard is more useful than a crowded one.
Finally, review the dashboard regularly and connect it to decisions. Business intelligence only works when the business uses it. A report should help people act.
| Step | What to Do |
|---|---|
| 1 | Define the business question |
| 2 | Identify the data sources |
| 3 | Clean and organize the data |
| 4 | Choose the most important KPIs |
| 5 | Build a simple report or dashboard |
| 6 | Review the dashboard regularly |
| 7 | Use the insights to make decisions |
A good first BI project could be a sales dashboard, a monthly executive report, a marketing performance dashboard, or a finance KPI report.
Common Business Intelligence Mistakes
- Many businesses struggle with BI because they start in the wrong place. One common mistake is building a dashboard before cleaning the data. A dashboard built on bad data only makes wrong numbers look more official.
- Another mistake is tracking too many KPIs. When a dashboard includes every possible metric, the most important numbers get lost. A good dashboard should focus on decisions, not decoration.
- Some businesses also choose tools too early. They may buy expensive software before understanding what data they have, what problems they need to solve, or who will use the reports.
- Another mistake is creating reports that no one reviews. A dashboard is only useful if it becomes part of the business process. Someone needs to review it, understand it, and act on it.
| Mistake | Why It Hurts | Better Approach |
|---|---|---|
| Building dashboards before cleaning data | Creates unreliable reports | Clean and validate the source data first |
| Tracking too many metrics | Makes dashboards confusing | Focus on KPIs tied to decisions |
| Choosing tools too early | Can waste money | Define the business need first |
| Ignoring profit | Revenue alone can be misleading | Track revenue, costs, and margin together |
| Creating reports no one uses | Wastes time | Build reports for real users and decisions |
| Updating reports manually forever | Creates errors and delays | Automate when reporting becomes repetitive |
| Using disconnected spreadsheets | Creates different versions of the truth | Build one clearer reporting process |
Good business intelligence should make reporting easier, not harder.
When to Request a Business Intelligence Project Review
A business intelligence project review is useful when your business needs better reporting, but you are not sure what to build first. You may need data cleaning, a dashboard, a KPI report, an executive report, marketing reporting, sales reporting, or a broader BI process.
The review helps identify what data you already have, where the data is messy, which reports are taking too long, and which dashboard would create the most value first. This matters because many businesses rush into BI tools before fixing the real reporting problem.
You should consider requesting a BI project review if your team manually updates reports, works from different spreadsheets, does not trust the numbers, or spends too much time searching for data. It is also useful if leadership keeps asking for the same reports in different formats.
A project review can help clarify which KPIs should be tracked, which reports should be automated, what data needs to be cleaned, and what dashboard would actually help the business. The goal is to avoid wasting time on the wrong project.
Sometimes the best first step is not building a dashboard. It may be cleaning the data, creating a simple KPI report, standardizing metric definitions, or building one clear executive view.
If your business needs help understanding what to do with your data, you can request a data project review
Business Intelligence and Data Cleaning
Data cleaning is one of the most important parts of business intelligence. If the data is messy, the dashboard will not be reliable.
Common data problems include duplicate records, missing values, inconsistent customer names, incorrect date formats, old data mixed with new data, and different teams using different definitions for the same metric.
For example, one spreadsheet may call a customer “ABC Company,” while another calls the same customer “ABC Co.” A dashboard may treat those as 2 different customers unless the data is cleaned first.
The same problem can happen with product names, lead sources, regions, dates, and revenue fields. If the data is inconsistent, the final report may be misleading.
Before building a BI dashboard, it is often better to clean and validate the source data. Clean data creates trust. Messy data creates confusion.
Business Intelligence and Forecasting
Business intelligence often focuses on what is happening now, but it can also support forecasting. Once a business has clean historical data and consistent reporting, it becomes easier to estimate future performance.
A business may use BI data to forecast revenue, demand, inventory, staffing, or cash flow. For example, a company may review the last 24 months of sales data to estimate next quarter’s revenue.
Forecasting does not guarantee the future, but it helps businesses plan with more confidence. A forecast can help a business prepare for busy seasons, adjust staffing, manage inventory, or set more realistic sales targets.
Business intelligence gives the business the historical data needed for better forecasting. Data analytics can then help interpret those trends and estimate what may happen next.
Business Intelligence and Executive Reporting
Executive reporting is one of the most valuable uses of business intelligence. Leaders do not always need every detail. They need a clear view of the numbers that matter most.
An executive BI report may include revenue, profit, cash flow, customer growth, sales pipeline, marketing performance, forecasted revenue, and key risks. The report should help leadership understand business health quickly.
A strong executive report should answer practical questions. Are we growing profitably? Which area needs attention? Are we on track for the month or quarter? What changed since the last report? What decision needs to be made?
When executive reporting is done well, leadership meetings become more focused. Instead of debating which numbers are correct, leaders can spend more time deciding what to do next.
Best First Step: Clean the Data Before Building BI Reports
Many businesses want dashboards because they need clearer reporting. That makes sense, but a dashboard should not be built on messy or unreliable data. A BI report is only as good as the data behind it.
If customer names are duplicated, product categories are inconsistent, dates are formatted incorrectly, or different teams define revenue differently, the dashboard may create confusion instead of clarity. It may look professional, but the numbers may still be wrong.
Before building a BI dashboard, the business should review the source data, clean obvious errors, standardize important fields, and confirm which KPIs matter most. This makes the final dashboard more accurate and easier to trust.
For example, a company may want an executive dashboard that tracks revenue, profit, leads, and cash flow. Before building that dashboard, it may need to confirm which revenue source is correct, how expenses are categorized, how leads are counted, and whether the data updates consistently.
The best first step is not always choosing the most advanced BI tool. The best first step is making sure the data is clean enough to support the decisions the business wants to make.
Request a Data Project Review
If your business has data but does not have clear reports, the best next step may be a data project review.
This review can help you understand whether you need business intelligence, data cleaning, a dashboard, a KPI report, a sales report, a marketing dashboard, an executive report, or a forecast. The right answer depends on your business goal and the condition of your data.
A data project review is especially helpful if your team is working from messy spreadsheets, manually updating reports, switching between too many tools, or making decisions without a clear view of the numbers.
Instead of starting with assumptions, start with a review of the data you already have.
Frequently Asked Questions About Business Intelligence
What is business intelligence in simple terms?
Business intelligence is the process of using business data to create reports, dashboards, and insights that help leaders make better decisions. It helps a business understand performance across sales, marketing, finance, operations, and customers.
What is an example of business intelligence?
An example of business intelligence is a dashboard that tracks revenue, profit, leads, conversion rates, customer growth, expenses, and sales performance. This helps leaders see what is happening in the business and decide what needs attention.
Why is business intelligence important?
Business intelligence is important because it helps businesses make decisions based on clear data instead of guesswork. It can improve reporting, reduce manual work, track KPIs, identify problems earlier, and give leaders a better view of performance.
What are business intelligence tools?
Business intelligence tools help businesses organize and visualize data. Common BI tools include Excel, Google Sheets, Power BI, Tableau, Looker Studio, SQL, CRM reports, and accounting reports.
Is business intelligence only for large companies?
No. Small businesses can use business intelligence too. A small business may start with a simple KPI report, sales dashboard, finance dashboard, or marketing report before moving into more advanced BI tools.
What is the difference between business intelligence and data analytics?
Business intelligence usually focuses on dashboards, reports, and tracking what is happening in the business. Data analytics is broader and can include deeper analysis, forecasting, and recommendations.
What should a business intelligence dashboard include?
A business intelligence dashboard should include the most important KPIs for the audience. This may include revenue, profit, leads, conversion rates, expenses, cash flow, customer growth, sales pipeline, or operational performance.
When should a business use business intelligence?
A business should use business intelligence when reports take too long to create, data is spread across multiple tools, leaders do not trust the numbers, or teams need a clearer way to track performance.
Can business intelligence help increase profit?
Yes. Business intelligence can help increase profit by showing which products, customers, channels, or services perform best. It can also help identify rising costs, low-margin offers, and areas where the business is wasting time or money.
Do I need business intelligence or data analysis?
You may need business intelligence if you need regular dashboards, KPI reports, and performance tracking. You may need data analysis if you have one specific question to answer. Many businesses need both.
What is the first step in a business intelligence project?
The first step in a business intelligence project is to define the business question and review the data you already have. Before building a dashboard, the business should understand which decisions need support, where the data comes from, whether the data is clean, and which KPIs matter most.
Business Intelligence Helps Businesses Make Better Decisions
Business intelligence helps businesses turn scattered data into clear reports, dashboards, and insights. It gives leaders a better way to understand what is happening across sales, marketing, finance, operations, customers, and overall performance.
For small businesses, BI does not need to start with expensive software or complex systems. It can begin with clean data, useful KPIs, simple dashboards, and reports that help people make better decisions.
The real value of business intelligence is not the dashboard itself. The value comes from the decisions the dashboard supports. A good BI process helps leaders see what changed, which areas need attention, and where the business should act next.
The most important thing is to connect business intelligence to real business questions. For example, which products are performing best? Which customer segments are most profitable? Leaders may also want to know which marketing channels are working, where costs are rising, which reports take too long to create, and what they need to review every month.
When business intelligence is done well, it saves time, improves reporting, increases trust in the numbers, and helps businesses act faster. It turns reporting from a manual task into a clearer decision system.
For a broader guide to using business data, read What Is Data Analytics? A Simple Guide for Businesses.
If your business needs help turning messy data into clear reports, dashboards, or forecasts, our Data Analysis Services can help you understand your numbers and choose the right next step.